
Connectivity vs Fear
Structure Tightens Before Volatility Reprices
Markets do not become fragile because volatility spikes.
They become fragile when structure tightens and independence disappears.
This Insight examines how cross-asset connectivity evolves across regimes, how diversification erodes beneath the surface, and what happens when coupling and shock size rise together.
Across cycles, one pattern repeats:
Structure tightens before stress becomes visible.
System Connectivity
When markets begin to trade as one system
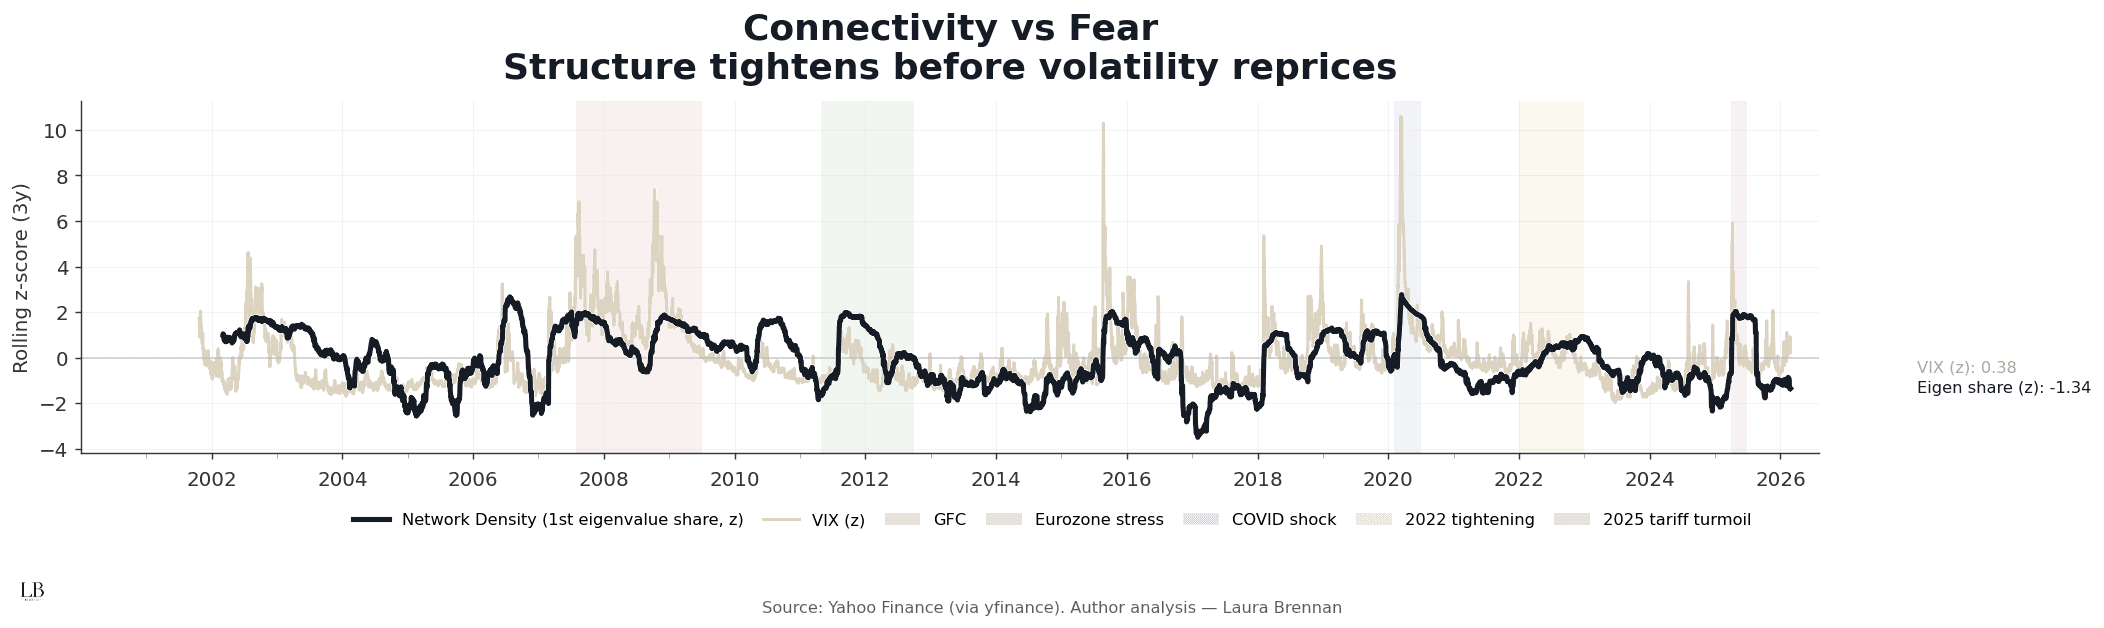
This chart compares rolling network density (first eigenvalue share, 90D window, 3Y z-score) with the VIX.
The eigenvalue share measures how much return variance is explained by the dominant common factor.
What it shows:
• Connectivity rises before volatility spikes
• Structural tightening precedes visible stress
• Calm volatility regimes can mask increasing coupling
• The system often synchronises before fear reprices
Volatility reacts.
Structure leads.
Effective Number of Independent Bets
When diversification becomes arithmetic
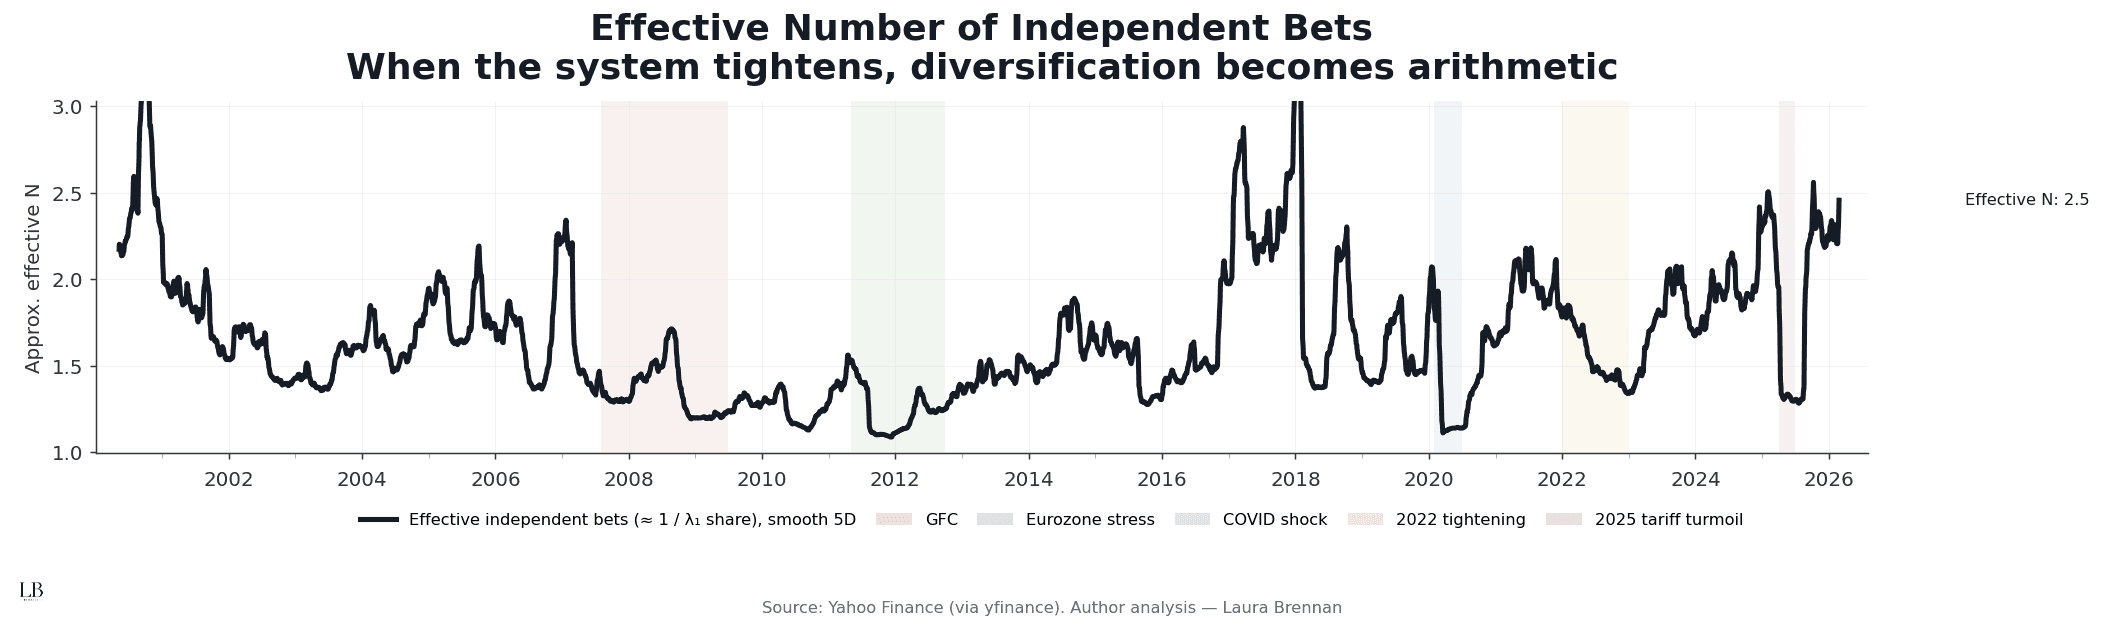
This chart converts the dominant eigenvalue share into an approximate effective number of independent bets (≈ 1 / λ₁ share).
Lower values imply fewer true sources of independence.
What stands out:
• Diversification compresses sharply during stress regimes
• Post-2008, effective independence rarely fully resets
• COVID was fast; structural memory lingered
• Recent tightening periods show elevated structural compression
Diversification weakens before portfolios realise it.
When the system tightens, independence declines mechanically.
Cascade Proxy
When coupling and shock size rise together
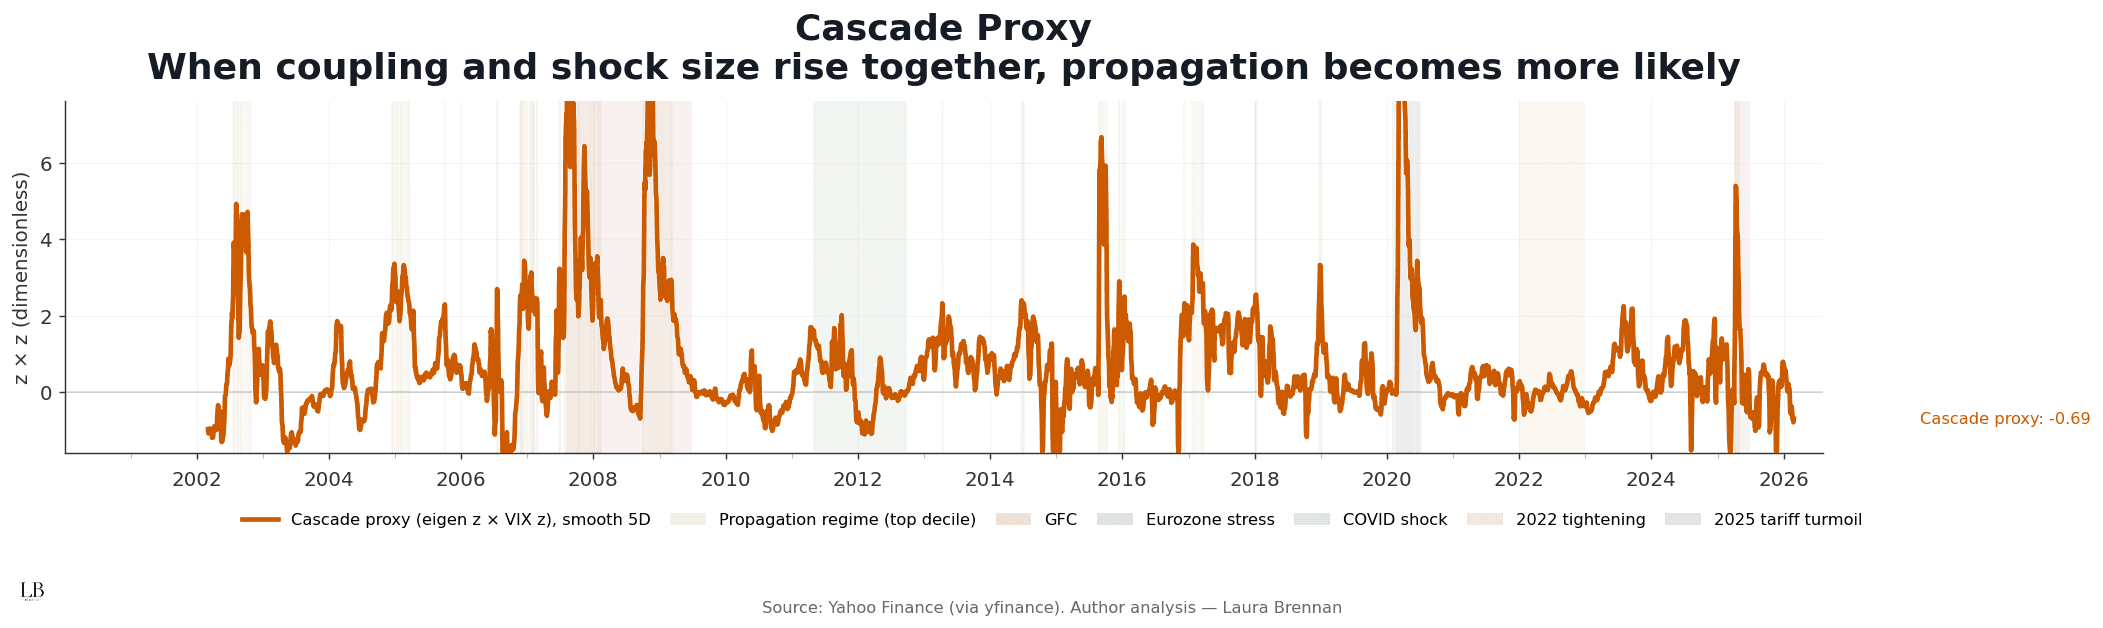
This chart multiplies structural connectivity (eigenvalue z) by shock intensity (VIX z).
It approximates the probability of propagation.
What emerges:
• High cascade states cluster around major crises
• Coupling alone is insufficient, shock size matters
• Shock size alone is insufficient, structure matters
• Propagation risk rises when both align
Contagion is conditional.
It requires both structure and trigger.
Credit Absorption
When propagation risk materialises
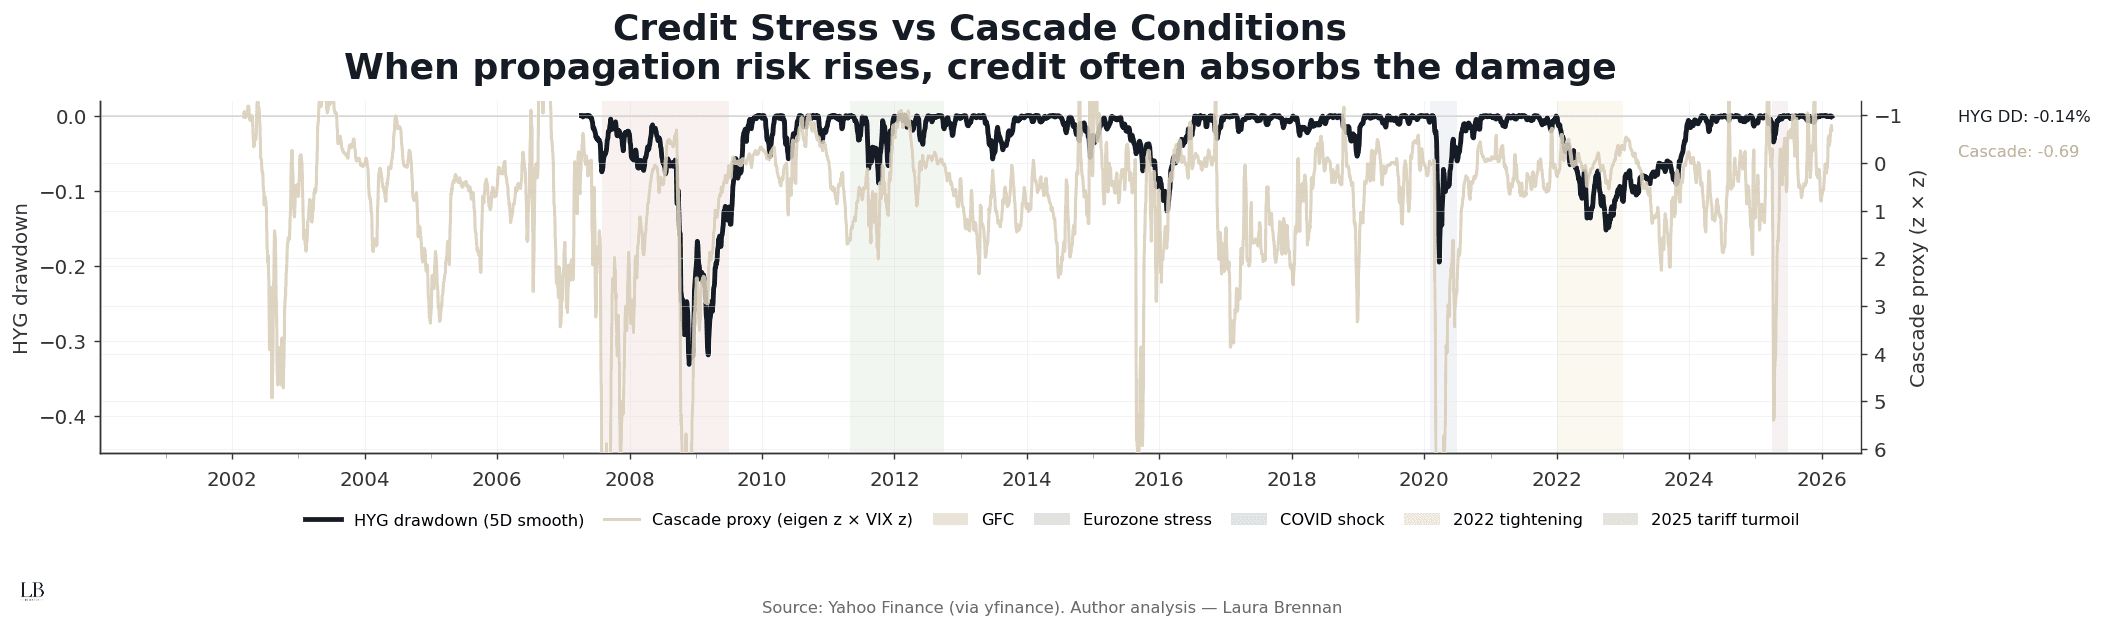
This chart compares high-yield credit drawdown (5D smoothed) with the cascade proxy.
How to read it:
• Cascade measures propagation conditions
• Drawdown measures realised damage
What becomes clear:
• Major cascade spikes coincide with credit stress
• Propagation regimes precede drawdown acceleration
• Recovery in credit lags structural normalisation
• Structural tightening leaves residual fragility
Credit often absorbs the consequences of structural coupling.
Stress travels through balance sheets.
The Structural Sequence
Across all four views, the conclusion is consistent:
• Connectivity rises before volatility reprices
• Diversification compresses before losses appear
• Propagation risk increases when coupling and shocks align
• Credit absorbs the damage once transmission begins
Systemic risk is not an event.
It is a state.
When the system becomes one trade, fragility increases.
Methodology
• Universe: Cross-asset ETF set (EEM, EWJ, EWU, VNQ, XLB, XLC, XLE, XLF, XLI, XLK, XLP, XLRE, XLU, XLV, XLY)
• Frequency: Daily
• Returns: Log returns
• Network metric: Rolling covariance PCA (90D window)
• Connectivity measure: First eigenvalue variance share
• Normalisation: 3-year rolling z-score (756D)
• Effective N: Approximation 1 / λ₁ share
• Cascade proxy: (Eigen z) × (VIX z), 5D smoothing
• Credit stress: HYG drawdown (5D smoothing)
• Source: Yahoo Finance
• Analysis: Laura Brennan


