
Efficiency Isn’t Liquidity
Why High Volume Can Still Mean Slow Price Discovery
Markets often look efficient when trading is busy.
But activity is not absorption.
And liquidity is not price discovery.
This Insight measures how quickly sector ETFs incorporate information, and how that speed shifts across cycles.
Across regimes, the message is consistent:
efficiency falls before stress becomes obvious.
Sector Efficiency Scores
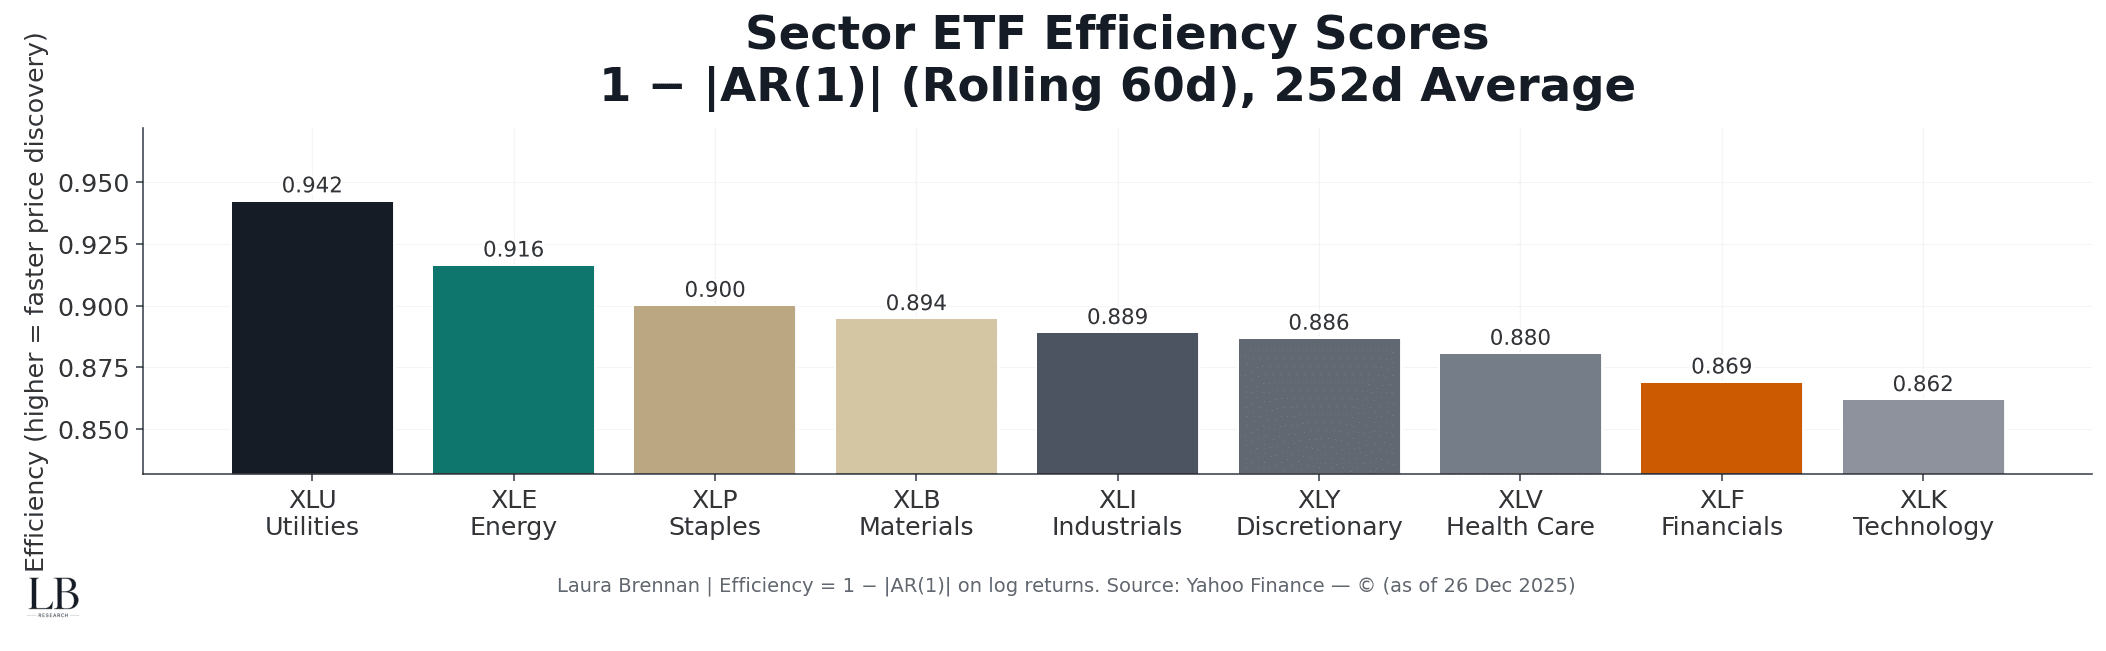
This chart ranks sector ETFs by price discovery speed.
Higher efficiency means weaker short horizon predictability in returns, consistent with faster adjustment.
• Utilities and Energy tend to absorb information faster
• Technology and Financials sit persistently slower in this sample
• The dispersion across sectors is meaningful, not noise
• “Efficient” is not the same as “safe”, it is a processing speed
Efficiency is a structural property.
It does not show up in headlines.
Relative Efficiency (Cross-Sectional)
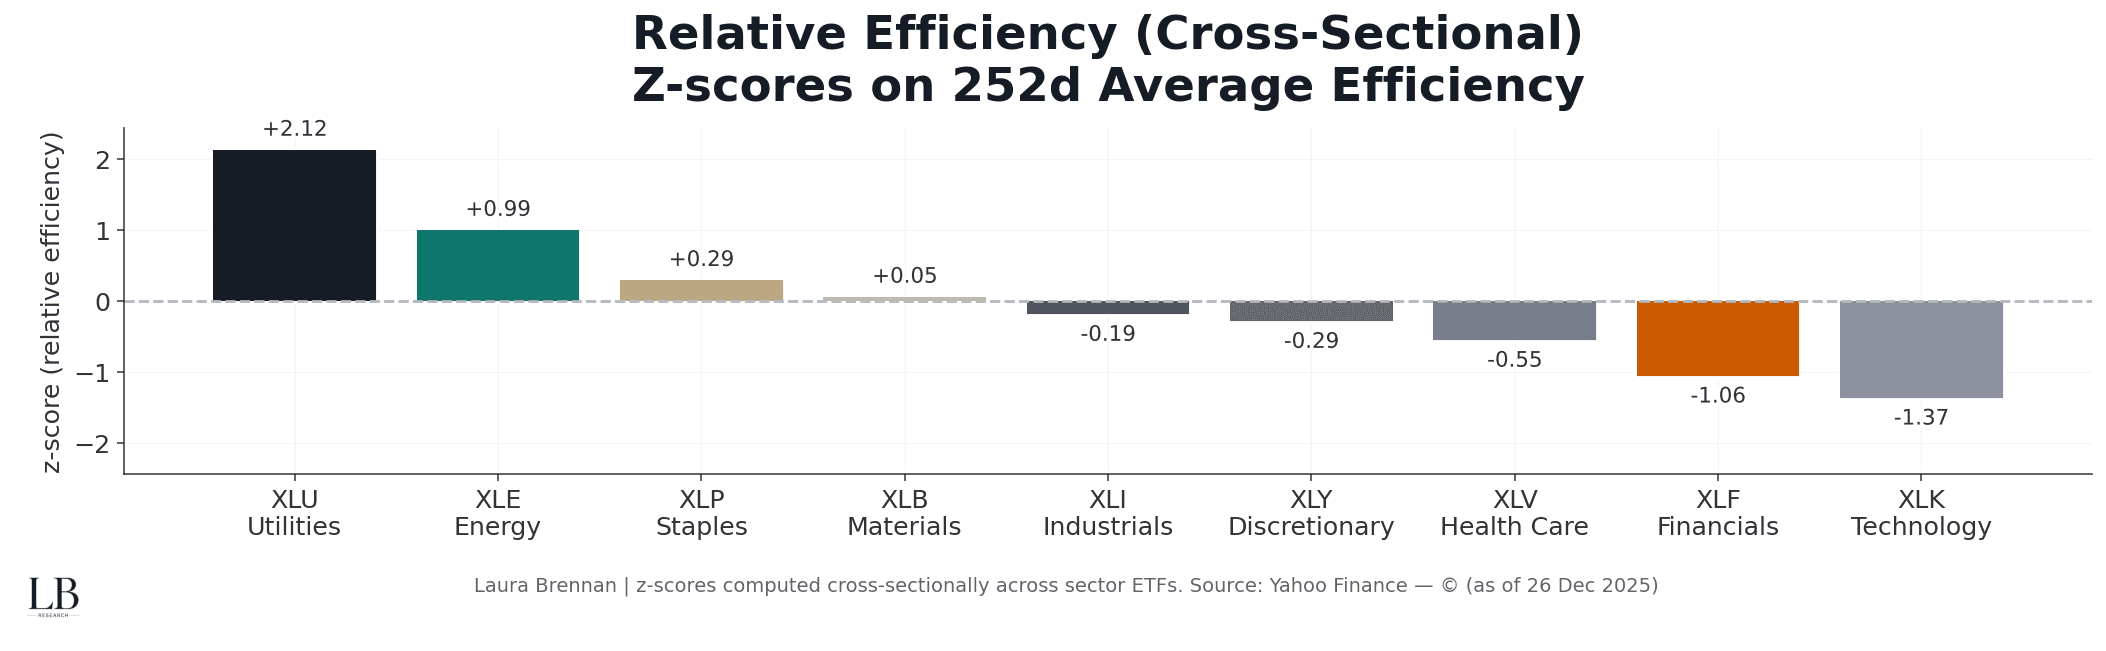
This chart removes levels and shows relative positioning.
It highlights which sectors are meaningfully above or below the cross-sectional norm.
• Outperformance here is structural, not momentum
• High positive z-scores imply consistently faster adjustment
• Deep negatives imply persistent frictions or slower digestion
• The ranking is stable enough to matter
Relative efficiency is where the signal lives.
Efficiency Regimes
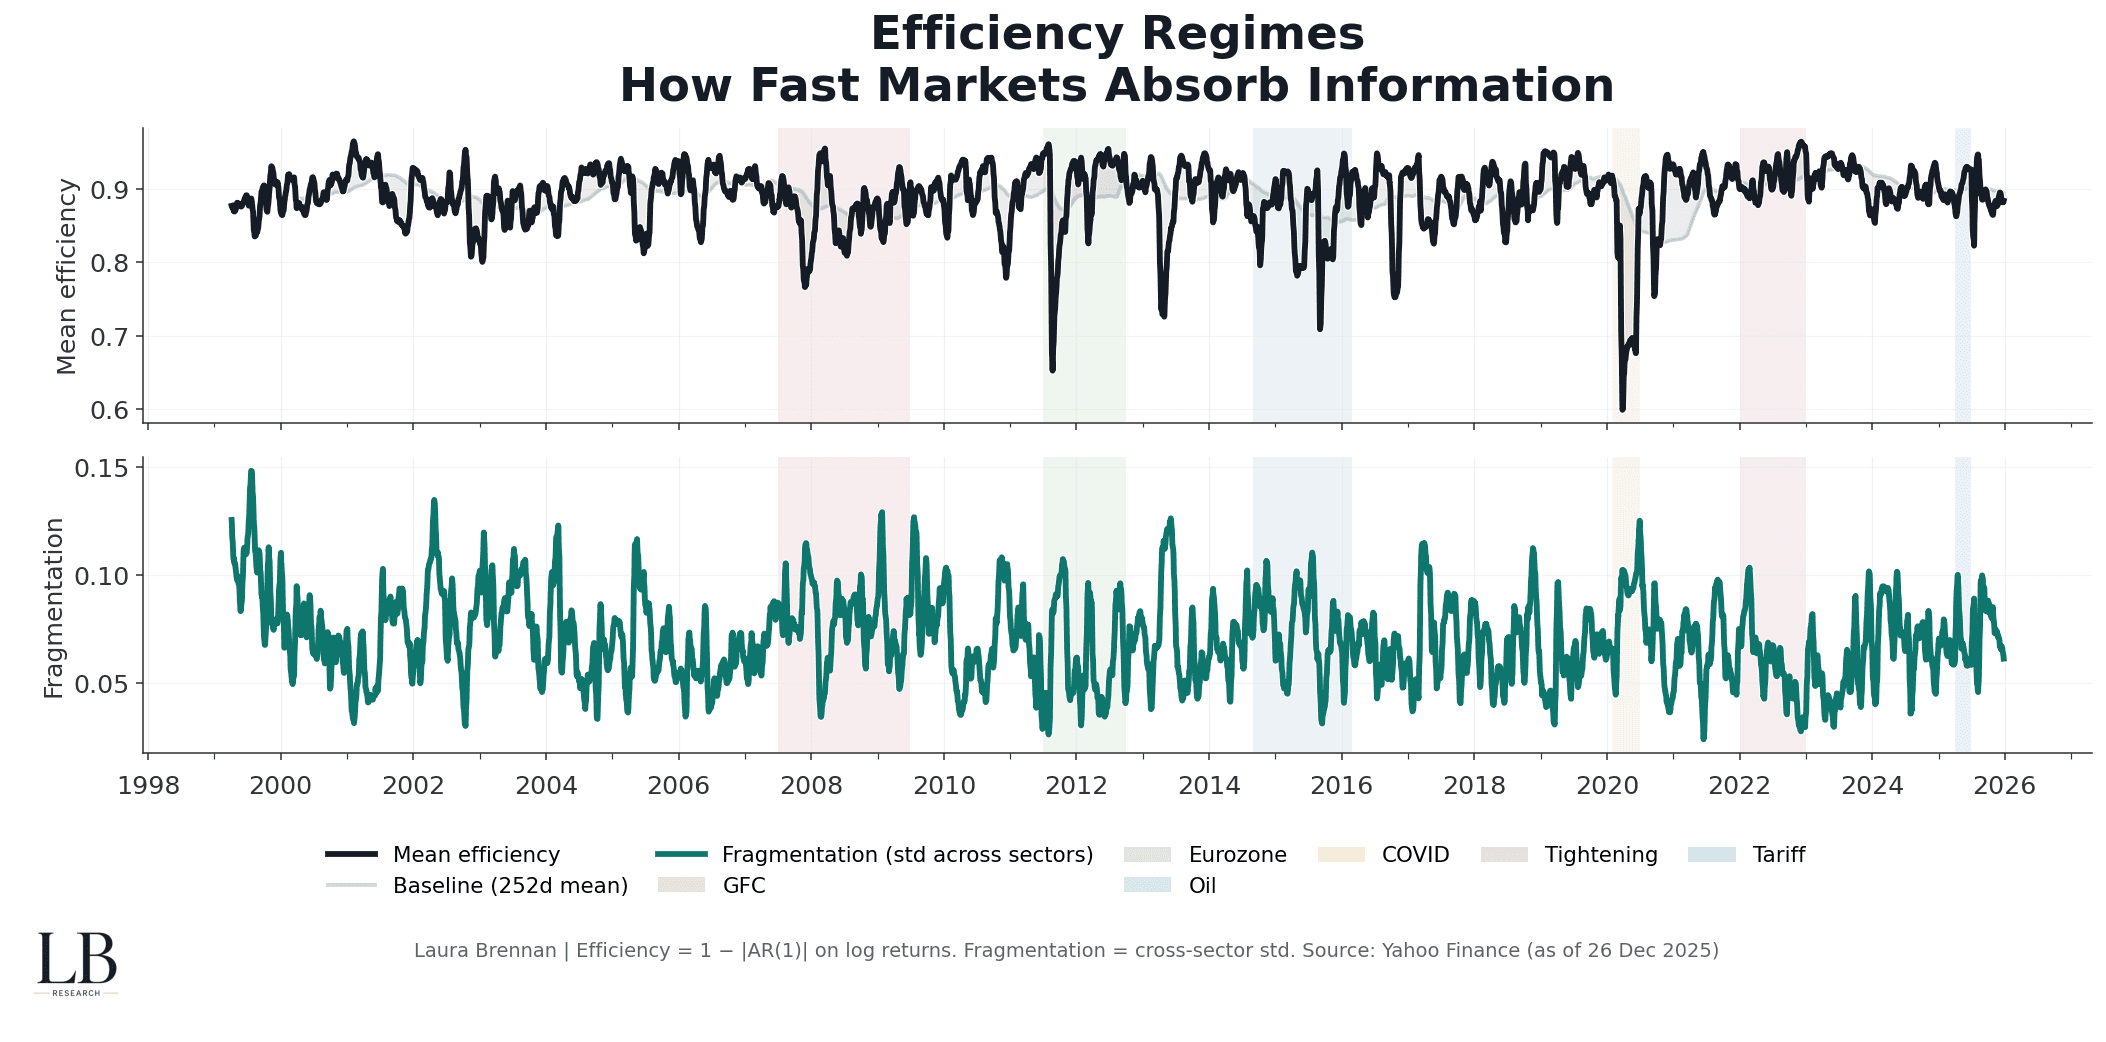
This chart shows the system through time.
It separates two ideas:
mean market processing speed
how unevenly that speed is distributed
• Mean efficiency falls in stress windows, even before volatility peaks
• The baseline highlights structural drift versus cycle noise
• The mean band shows when the system is running “above” or “below” its own normal
• Fragmentation rises when sectors stop updating uniformly
Stress is not just lower efficiency.
It is uneven efficiency.
Efficiency vs Volatility
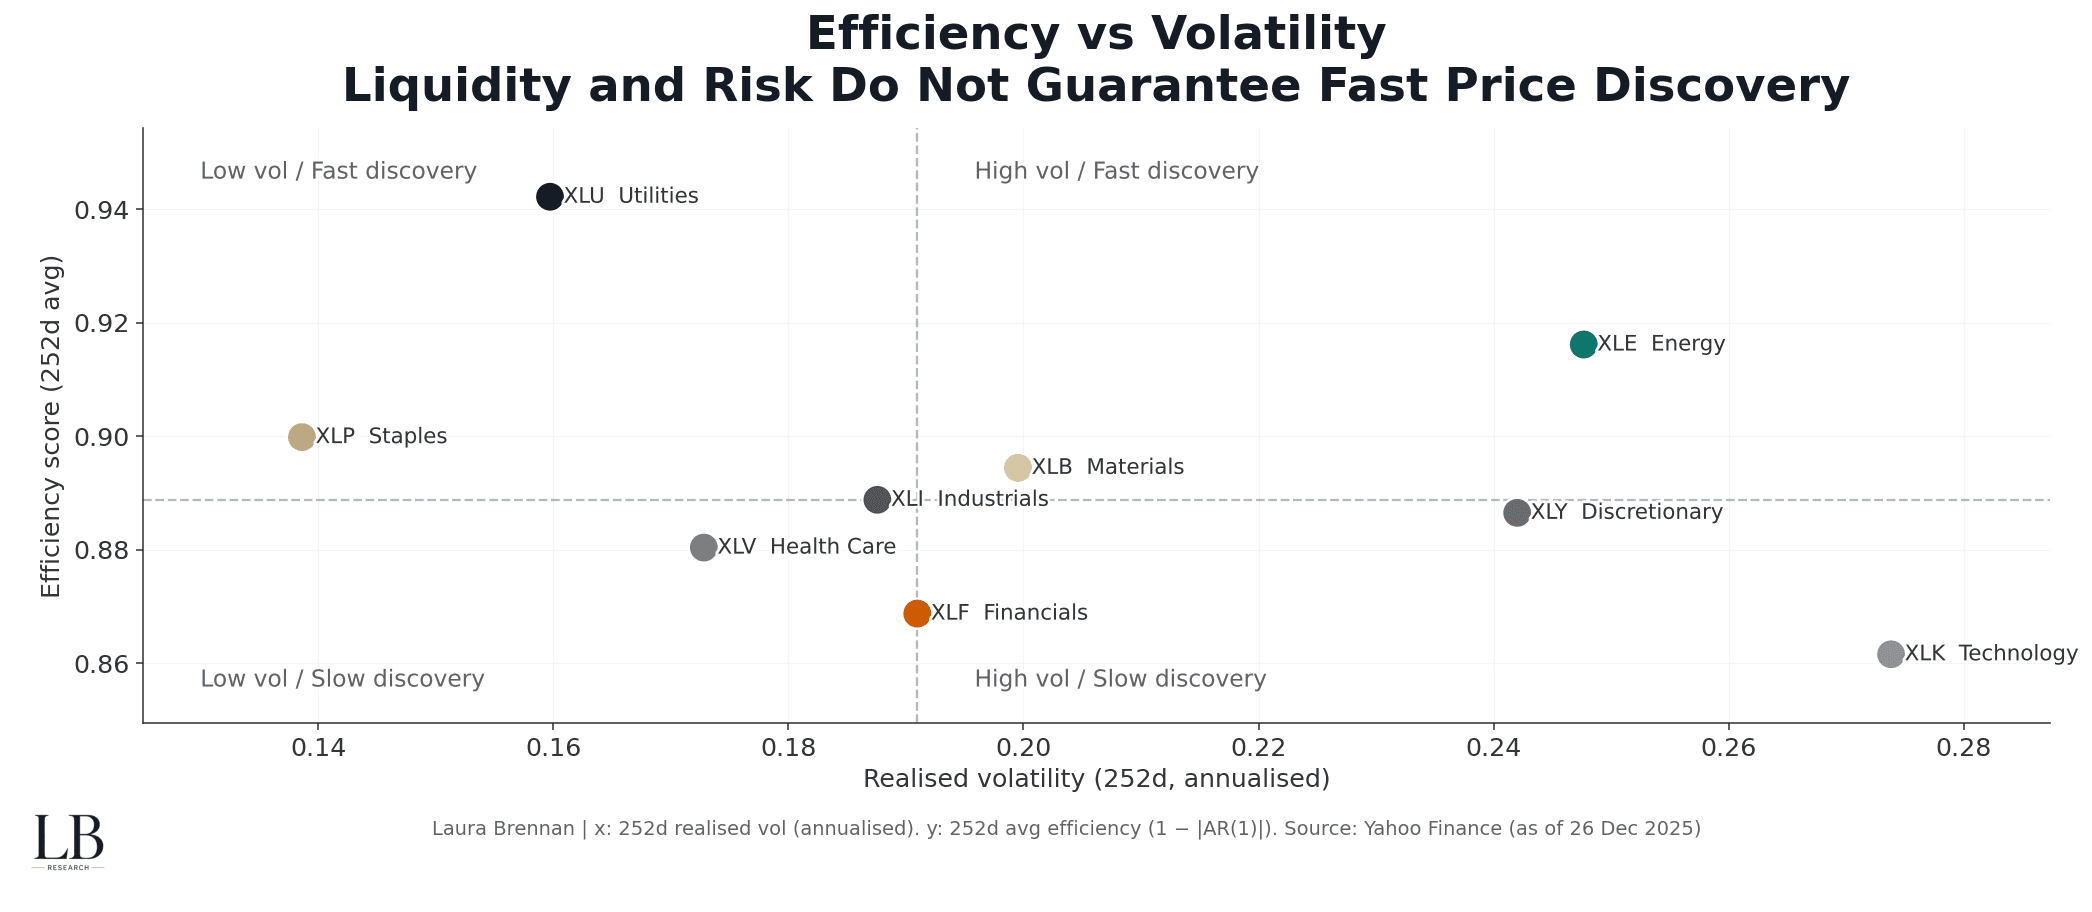
This chart shows why volatility is an incomplete proxy for structure.
High volatility does not guarantee fast discovery.
Low volatility does not guarantee efficiency.
Quadrants (median split):
• Low vol / Fast discovery
• High vol / Fast discovery
• Low vol / Slow discovery
• High vol / Slow discovery
• Some sectors stay slow even when volatility is elevated
• Some remain fast in calm regimes
• Volatility describes movement, not processing
• Efficiency reveals how cleanly information clears
Liquidity and risk do not guarantee fast price discovery.
The Structural Read
Across all four views, the conclusion is the same:
• efficiency is not constant
• regimes exist and persist
• fragmentation is a stress amplifier
• volatility can mislead if structure is deteriorating
Markets can look tradable while becoming harder to clear.
Methodology
• Daily sector ETF data
• Universe: US sector ETFs (XLU, XLE, XLP, XLB, XLI, XLY, XLV, XLF, XLK)
• Returns: log returns
• AR(1): rolling 60-day autocorrelation (lag 1)
• Efficiency: 1 − |AR(1)|
• Efficiency score: 252-day average of daily efficiency
• Fragmentation: cross-sector std of daily efficiency
• Realised vol: 252-day rolling volatility (annualised)
• Event windows: major stress regimes for alignment
• Sources: Yahoo Finance
• Analysis: Laura Brennan


