Market Structure
ES Curve Stress Map
Dec 11, 2025

ES Curve Stress Map
When Futures Structure Quietly Shifts Before Price Does
Futures structure moves long before equity index levels acknowledge it.
One of the earliest ways to see that shift is through the ES curve, the relationship between the front-month and second-month E-mini S&P 500 futures contracts.
Most of the time it is quiet. When it twitches, there is usually a reason.
This Insight decomposes the curve into four structural layers:
The curve pulse – rebased levels, the slow foundation
Curve stress – the z-score spread vs vol-of-vol
The architecture – how the spread behaves through regimes
Joint stress mapping – when curve pressure meets volatility pressure
Together, they form a structural read of market fragility that sits beneath sentiment, headlines, and realised volatility.
The Pulse: Front vs Second Month Levels
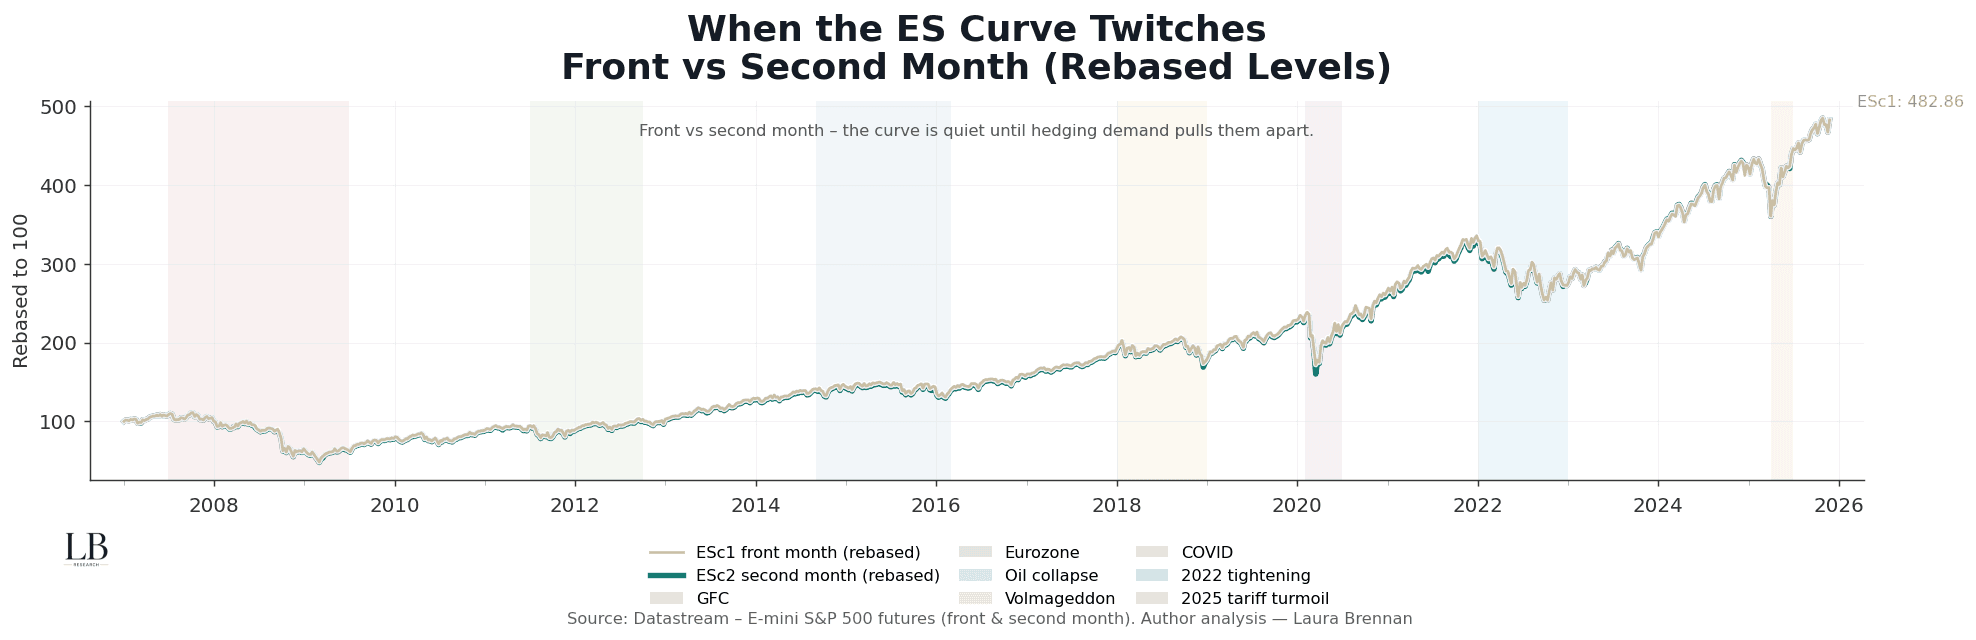
The rebased curve tracks the relative behaviour of the front and second month contracts.
Most of the time they move in tandem, a healthy term structure where hedging flows and roll mechanics remain orderly.
When they diverge, the system is signalling:
• rising hedging demand
• liquidity withdrawal
• stress in carry or funding channels
• episodes where the curve becomes the message, not the noise
Across the long sweep:
2007–09: deep dislocation through the GFC.
2011–12: a Eurozone-driven flattening of the entire structure.
2015–16: oil-led volatility tightened the curve sharply.
2018: vol-compression and forced de-risking.
2020: COVID shock, extreme, fast alignment then rupture.
2022: macro tightening compressed the curve into a single trade.
2025: tariff turmoil shows how fast the front month can detach.
The curves do not need to blow out to matter.
They only need to stop agreeing.
Curve Stress: Z-Scores vs Vol-of-Vol
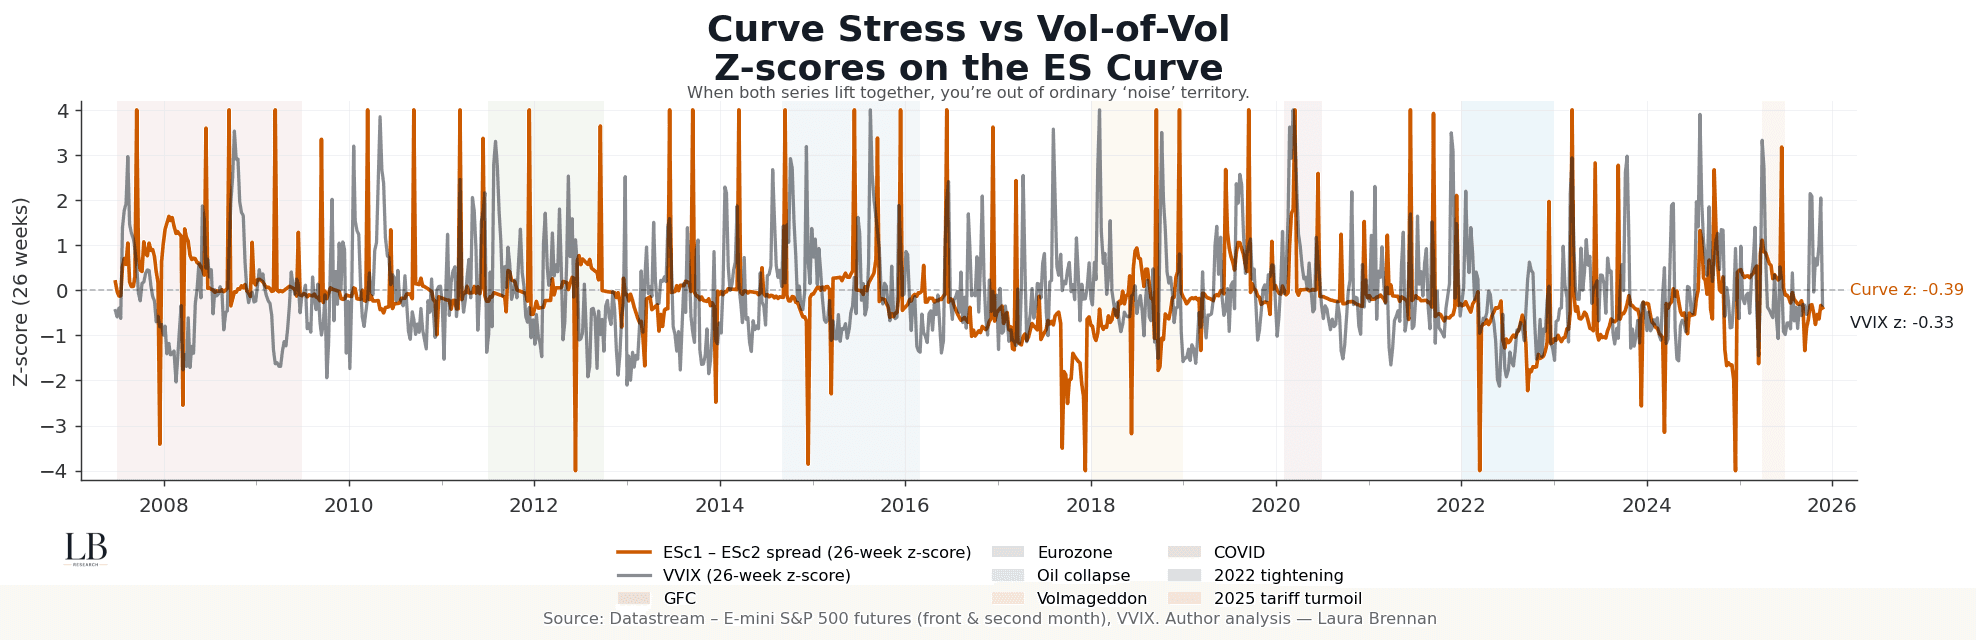
The curve spread, front minus second month, becomes far more informative when viewed as a 26-week z-score.
A rising z-score is not about points, it is about pressure:
• pressure from hedging
• pressure from volatility demand
• pressure from liquidity drying at the margin
Overlaying VVIX (also z-scored) shows the structural heartbeat of vol-of-vol, an early tell for instability.
The key pattern is simple:
When both lift together, you have left ordinary noise territory.
Historical patterns:
• GFC: strong co-movement, curve stress + vol-of-vol in unison
• Eurozone crisis: persistent, grinding elevation
• Oil collapse: repeated spikes, structural tension
• Volmageddon: sharp, narrow burst
• COVID: synchronized extremes
• 2022 tightening: a macro-single-factor regime
• 2025 tariff turmoil: short, sharp dislocation in both series
The joint elevation is what matters, it is rarely benign.
The Architecture: The Spread in Points
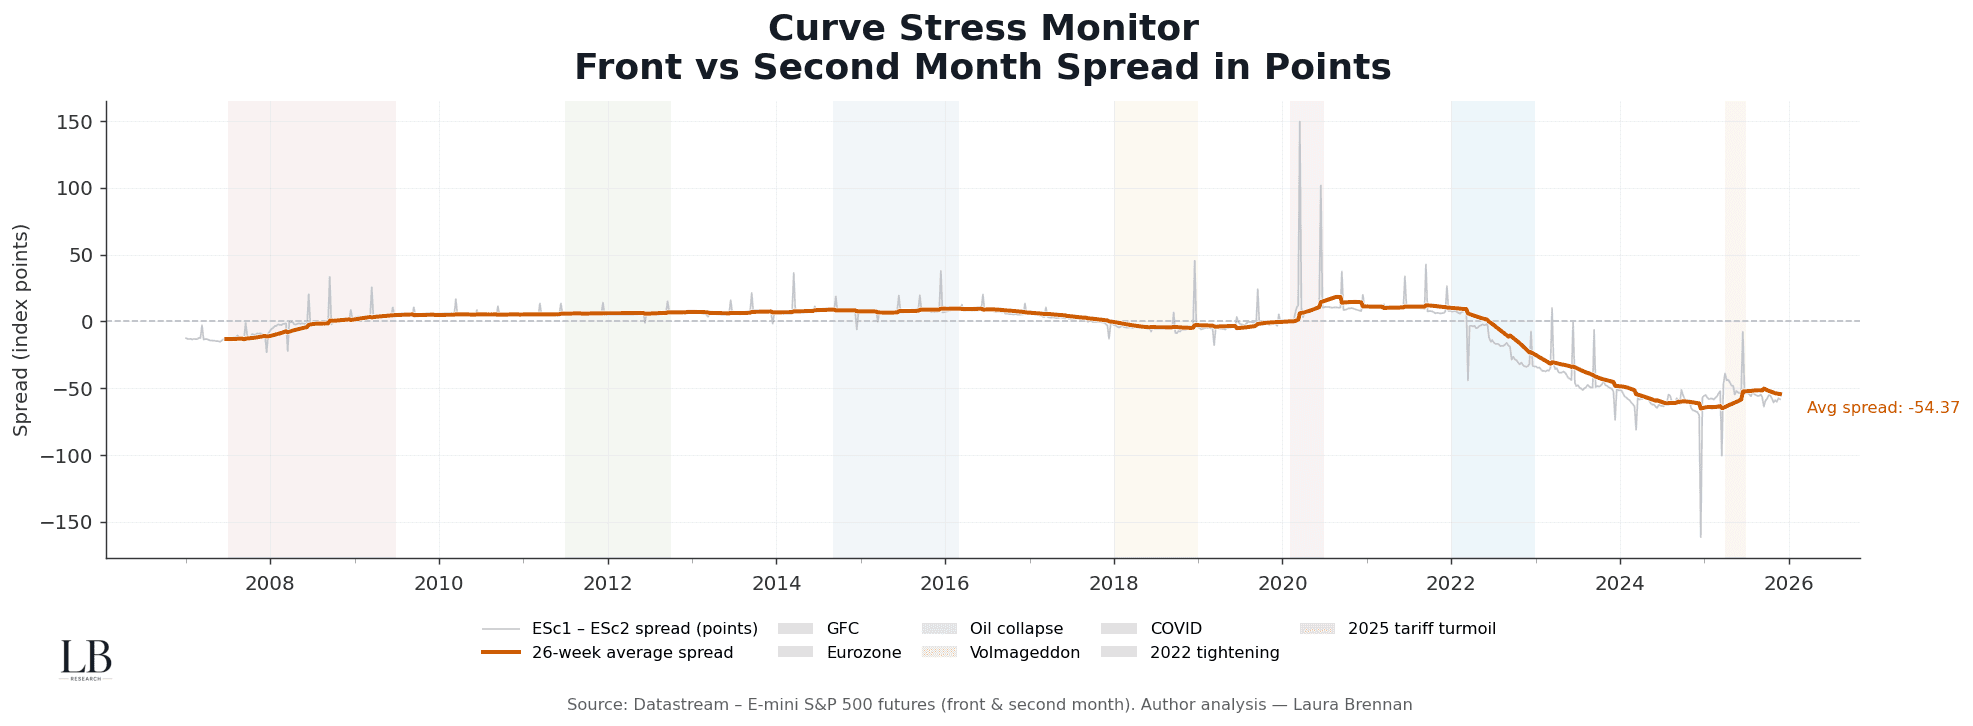
The absolute spread in points reveals the underlying architecture of the curve.
A low or negative spread does not imply stress on its own.
What matters is whether the moving average starts to drift, or whether the front month pulls away faster than liquidity conditions justify.
In the structural timeline:
• 2007–09: sustained dislocation
• 2011–12: compression with rollover stress in pockets
• 2015–16: repeated oscillation around zero, reflecting fragile liquidity
• 2018: tightening into vol-compression
• 2020: the architecture strained then snapped
• 2022: macro tightening created a long compression regime
• 2024–25: the curve weakened steadily, hinting at early stress despite rising index levels
The current read shows the average spread sitting negative, drifting lower, a quiet warning that hedging demand and liquidity asymmetry have returned.
The architecture adjusts long before the market narrative does.
Joint Stress Map: Curve Pressure × Vol-of-Vol Pressure
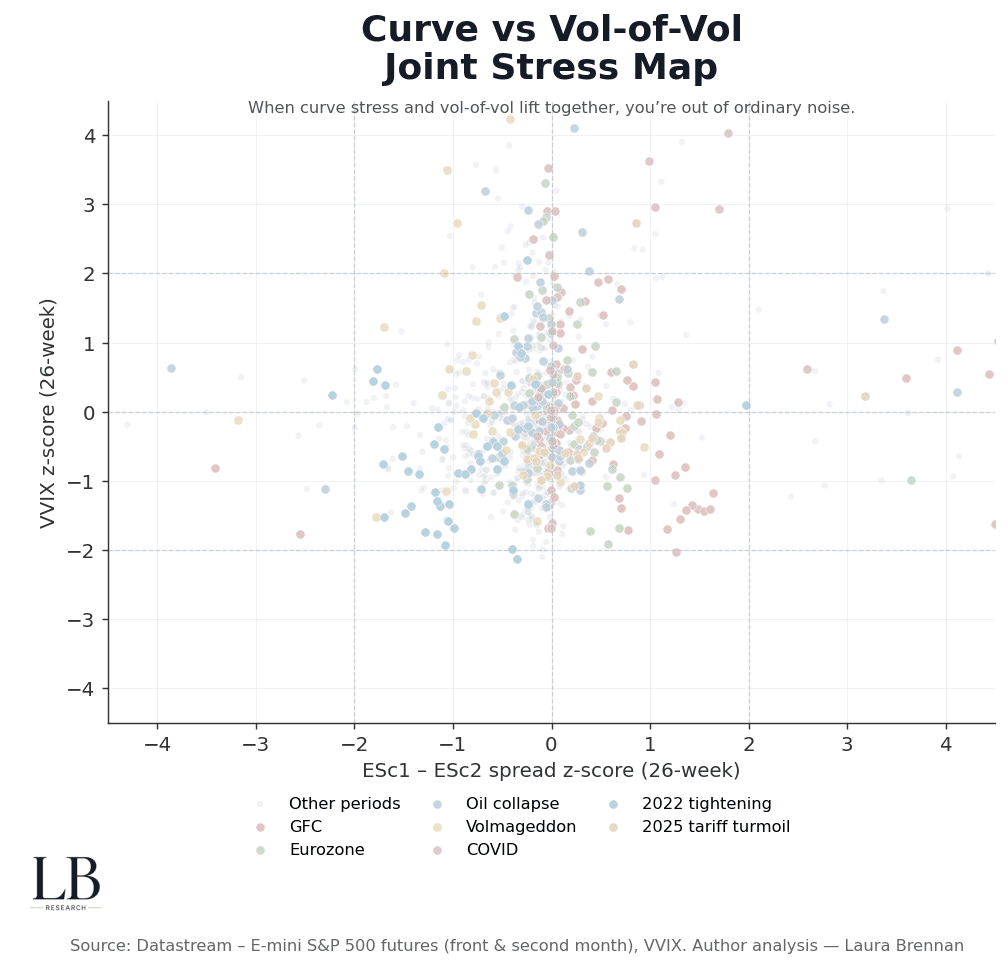
This joint map brings together the two structural forces:
(1) curve stress
(2) volatility-of-volatility stress
Most observations cluster harmlessly around the centre, the system’s natural resting state.
But event windows show clear structural fingerprints:
• GFC: extreme left-tail readings
• Eurozone: clustered tension, persistent, directional
• Oil collapse: high kurtosis, sharp spikes
• COVID: far-right volatility bursts
• 2022 tightening: broad compression, macro dominates
• 2025 tariff turmoil: short but high-amplitude stress
The scatter is not noise.
It is a map of how the system behaves when squeezed.
When both dimensions elevate together, you are no longer in a normal regime, you are in structure-constrained markets, where positioning, hedging, and volatility supply drive outcomes more than fundamentals.
The Structural Read Today
Across all four layers:
The pulse:
Front and second month remain mostly aligned, but with subtle divergence around stress windows.
Curve stress:
Z-scores sit mildly negative, but the pattern is unstable, small moves are becoming more amplified.
Architecture:
The average spread is negative and drifting, unusually so for a period of index strength.
Joint stress:
The system has not broken, but the clustering pattern resembles pre-transition regimes seen in early 2011, late 2017, and mid-2022.
This is not a stable structure.
It is a system deciding what it wants to become.
When structure tightens, markets can rally indiscriminately.
When it fractures, volatility becomes directional again.
Right now, the curve sits in between.
Methodology
• Weekly Datastream series for E-mini S&P 500 futures (front and second month)
• Rebased levels for structural alignment
• 26-week z-scores for spread and VVIX
• 26-week rolling average for architecture drift
• Event windows applied ex-post (GFC, Eurozone, Oil Collapse, Volmageddon, COVID, 2022 tightening, 2025 tariff turmoil)
• Analysis by Laura Brennan, LB Research


