Macro
Liquidity Is a Learning Problem
Feb 26, 2026

Liquidity Is a Learning Problem
Why shared signals rise faster than execution quality
Markets do not struggle because information is missing.
They struggle because learning outpaces execution.
This Insight examines how quickly markets learn relative to how efficiently they trade, and what happens when those two processes fall out of sync.
Across cycles, the message is consistent:
shared signals emerge before liquidity adjusts.
Learning vs Execution
When markets agree before they can trade
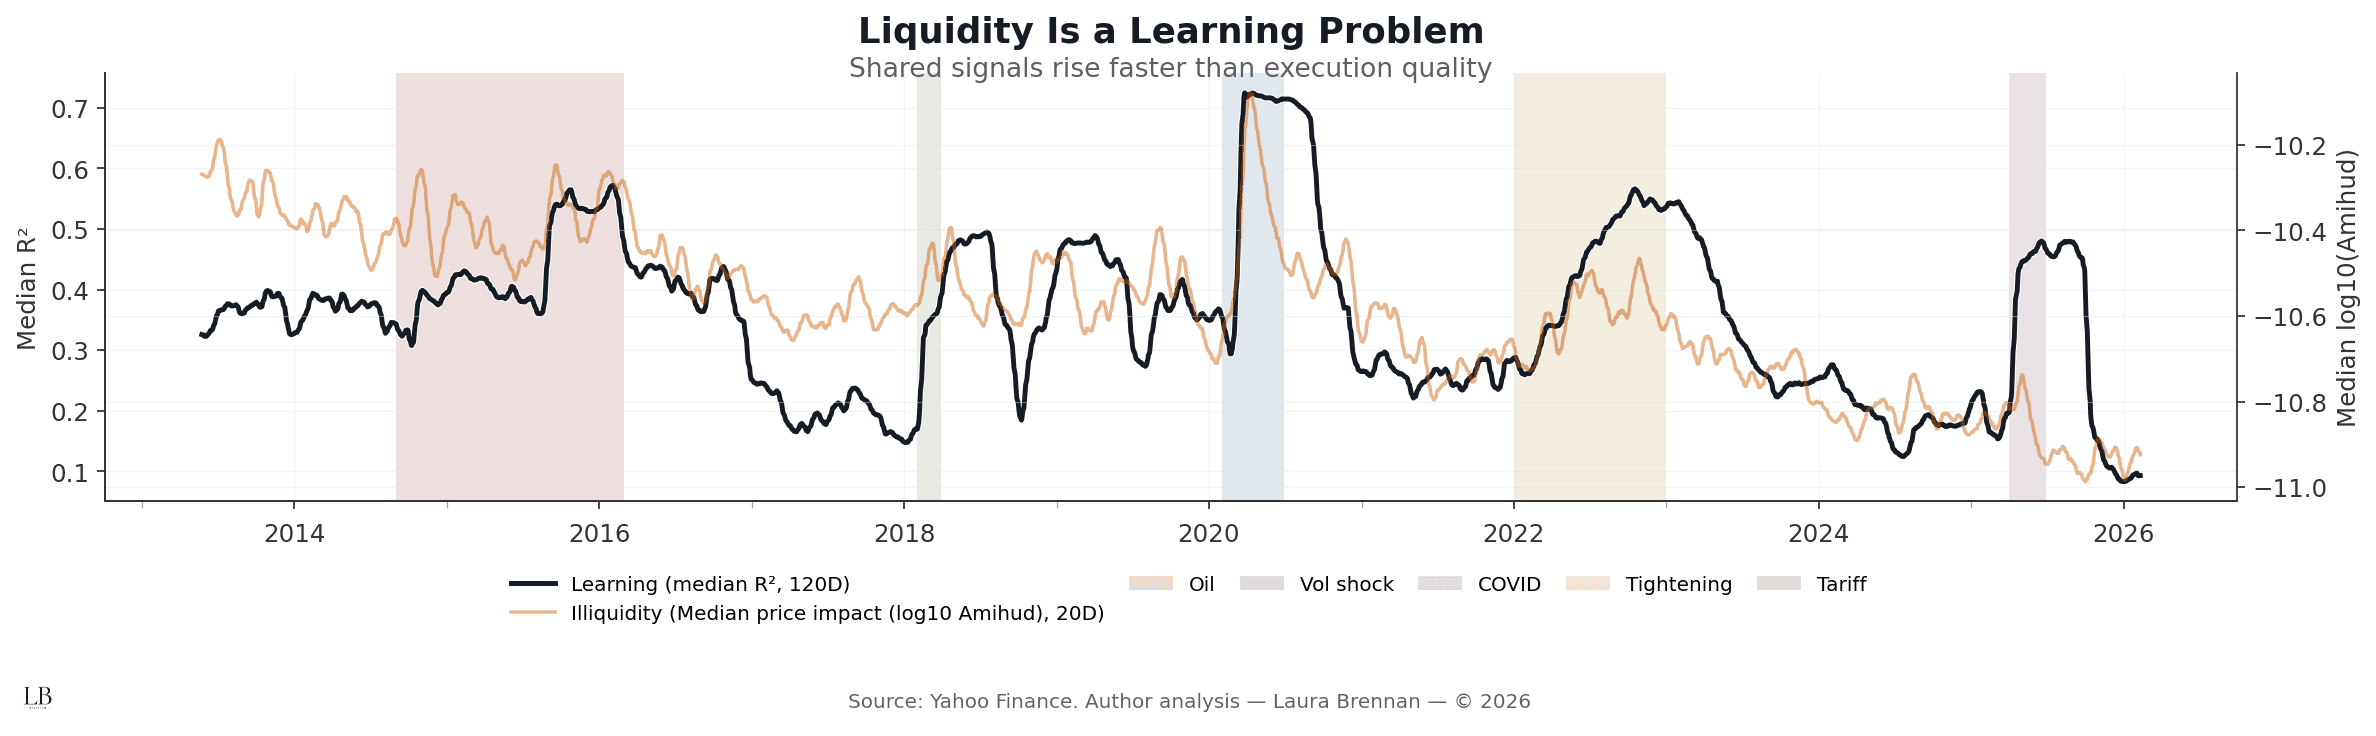
This chart compares two system-level processes:
• Learning median rolling R² of S&P 150 stocks against SPY
• Execution quality median price impact (log10 Amihud)
What it shows:
• Learning rises sharply during stress regimes
• Illiquidity deteriorates more slowly and often later
• The gap widens most during structural episodes, not one-day shocks
• Markets can “know” something before they can efficiently express it
Information is absorbed faster than it can be traded.
Liquidity reacts after learning has already occurred.
Learning Without Consensus
Shared signals do not imply agreement
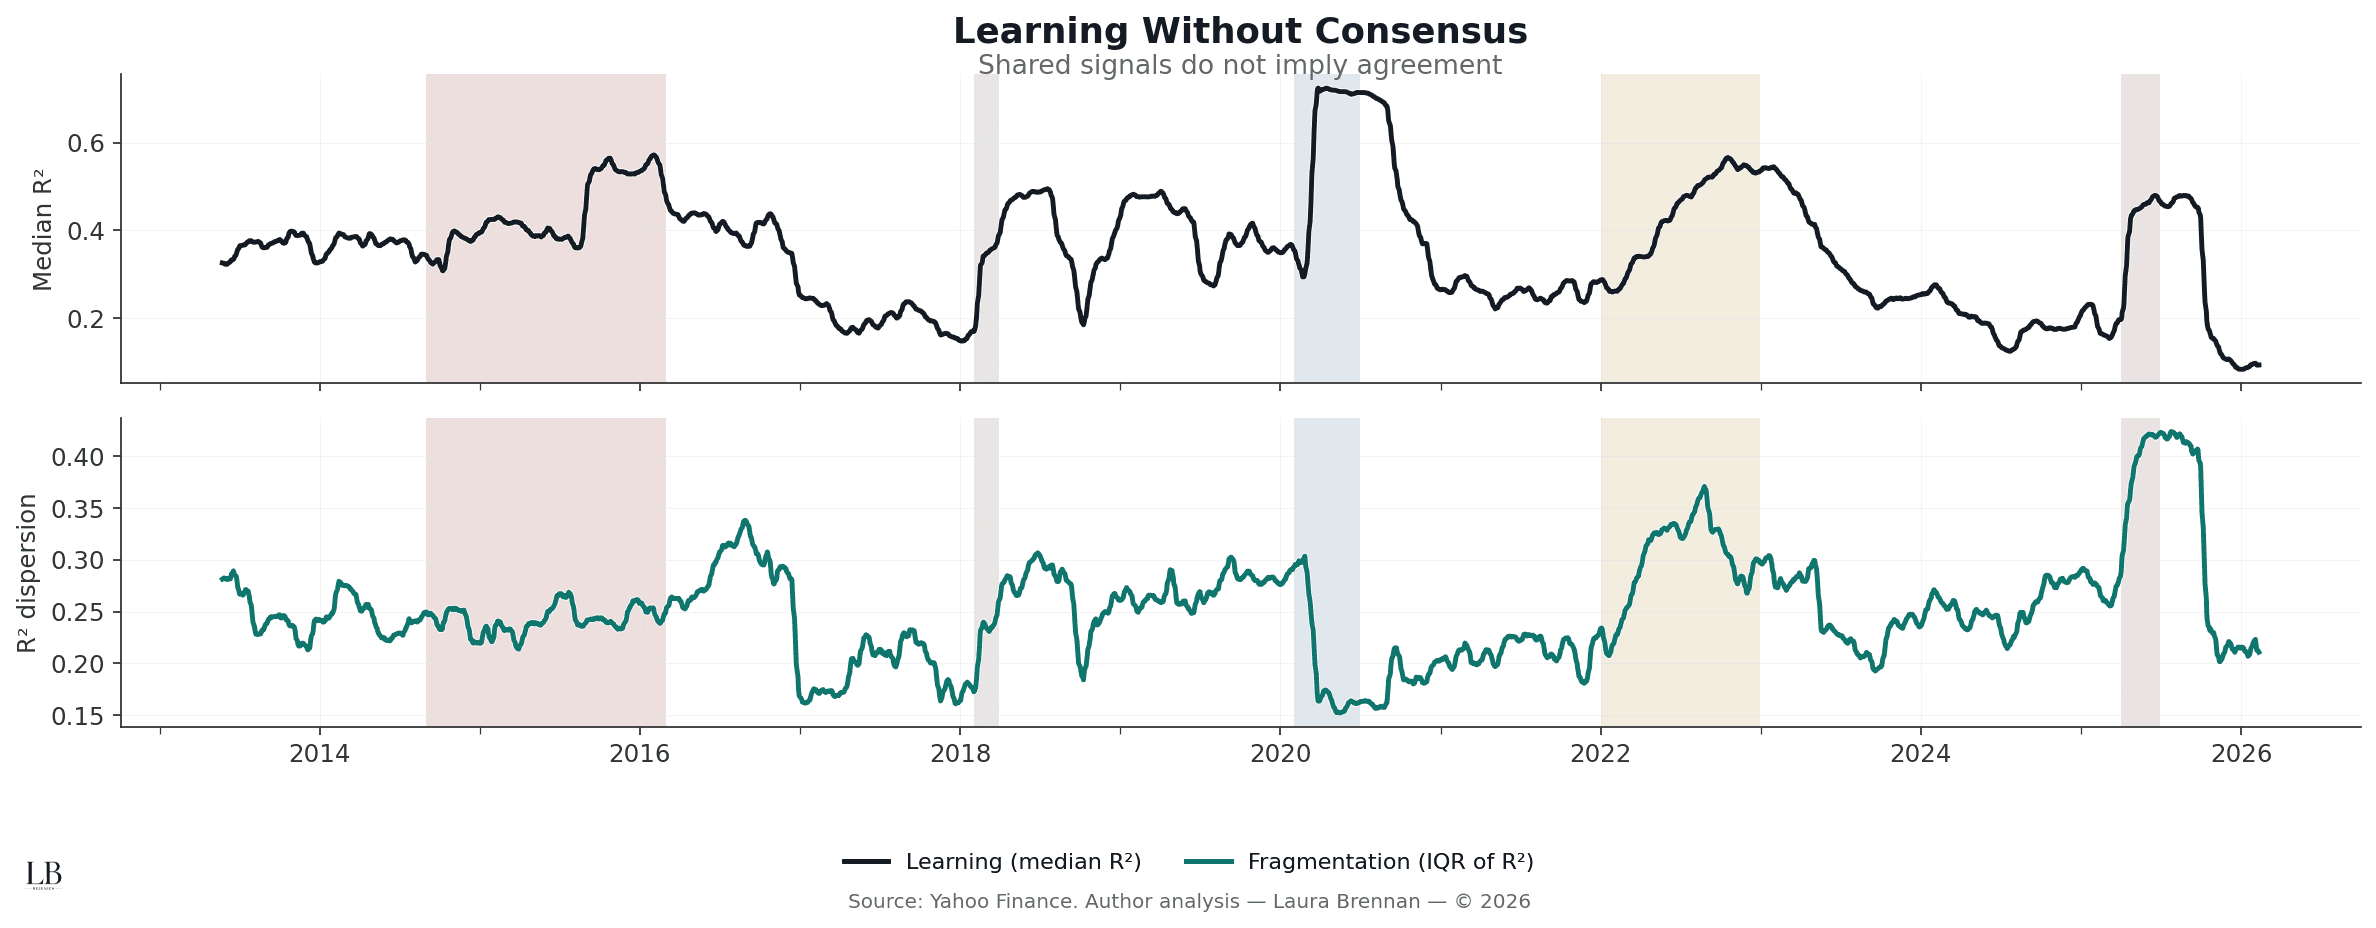
This chart separates how much the market learns from how evenly that learning is distributed.
It plots:
• Median learning (R²)
• Cross-sectional dispersion in learning (IQR of R²)
What stands out:
• Learning rises without dispersion collapsing
• Shared signals coexist with disagreement
• High R² does not imply consensus
• Fragmentation persists even when signals strengthen
Markets can move together while still disagreeing underneath.
Correlation is not coordination.
Who Moves First?
Does learning lead execution quality, or does price impact deteriorate first?
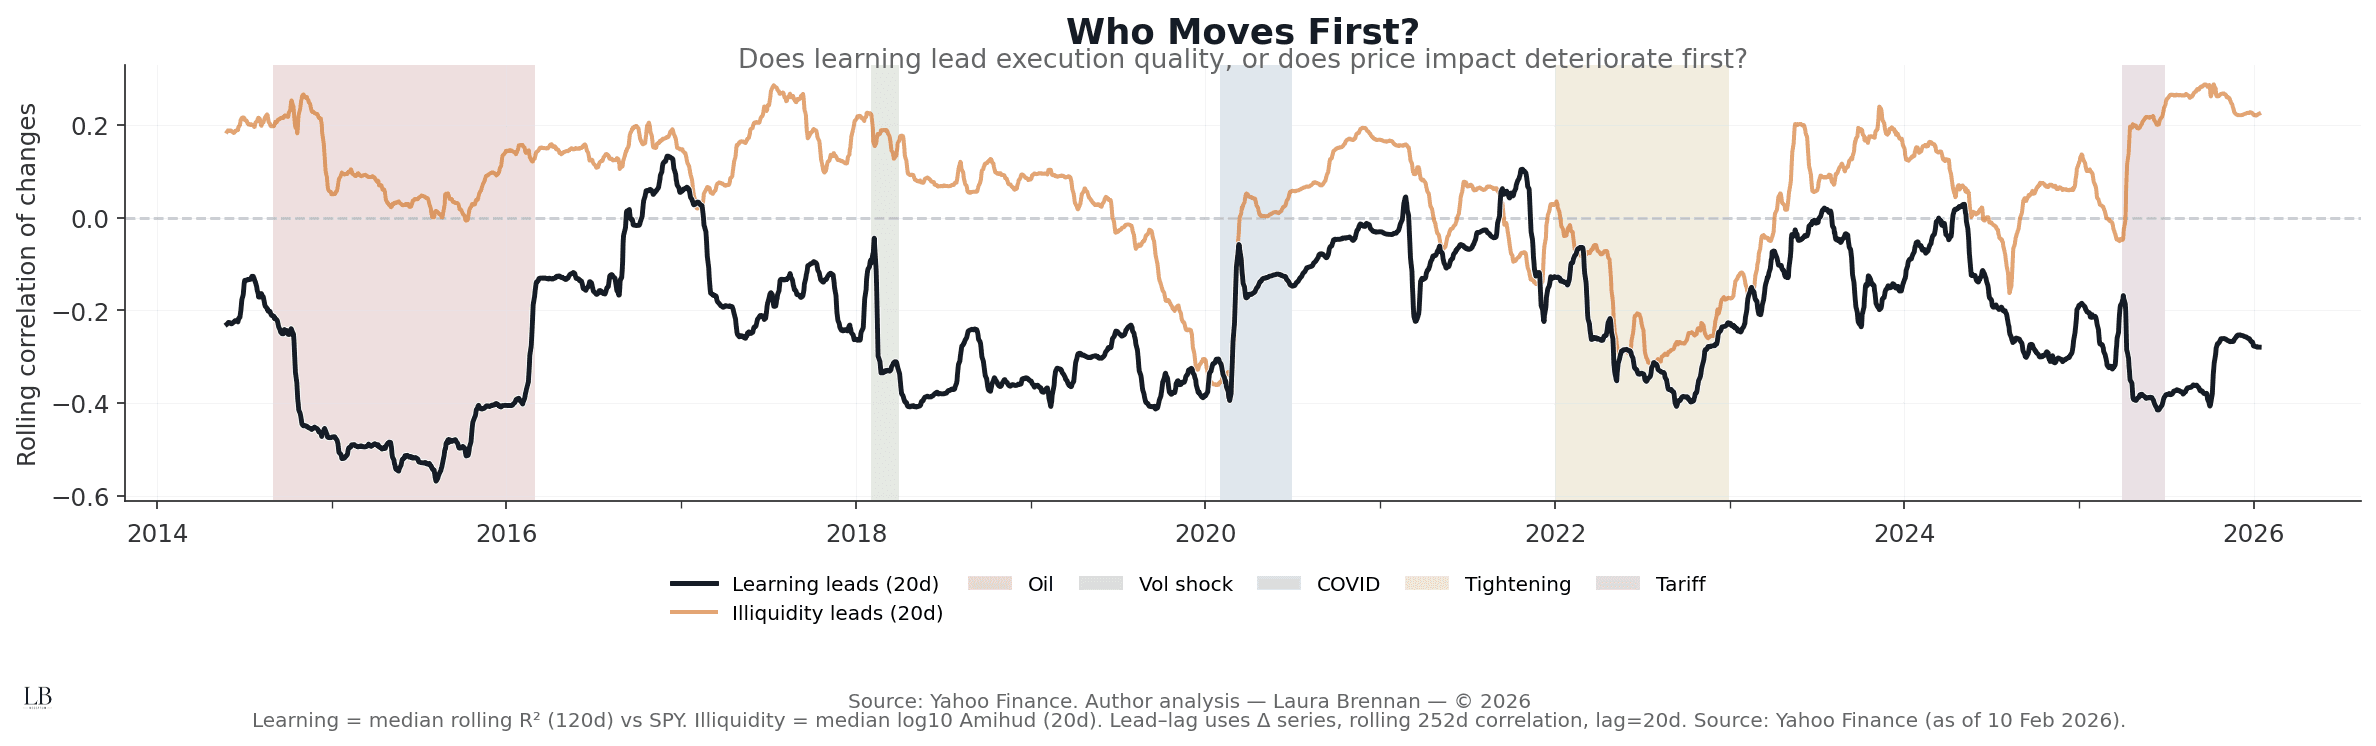
This chart tracks rolling lead–lag correlations between changes in learning and changes in illiquidity.
How to read it:
• Positive values → learning leads liquidity deterioration
• Negative values → illiquidity deteriorates first
What emerges:
• Leadership switches across regimes
• Learning often leads during structural build-ups
• Illiquidity tends to lead during acute dislocations
• There is no single ordering — timing depends on regime
Markets do not break the same way every time.
But learning is rarely the bottleneck.
Who Moves First?
Cross-sectional leadership across the S&P 150
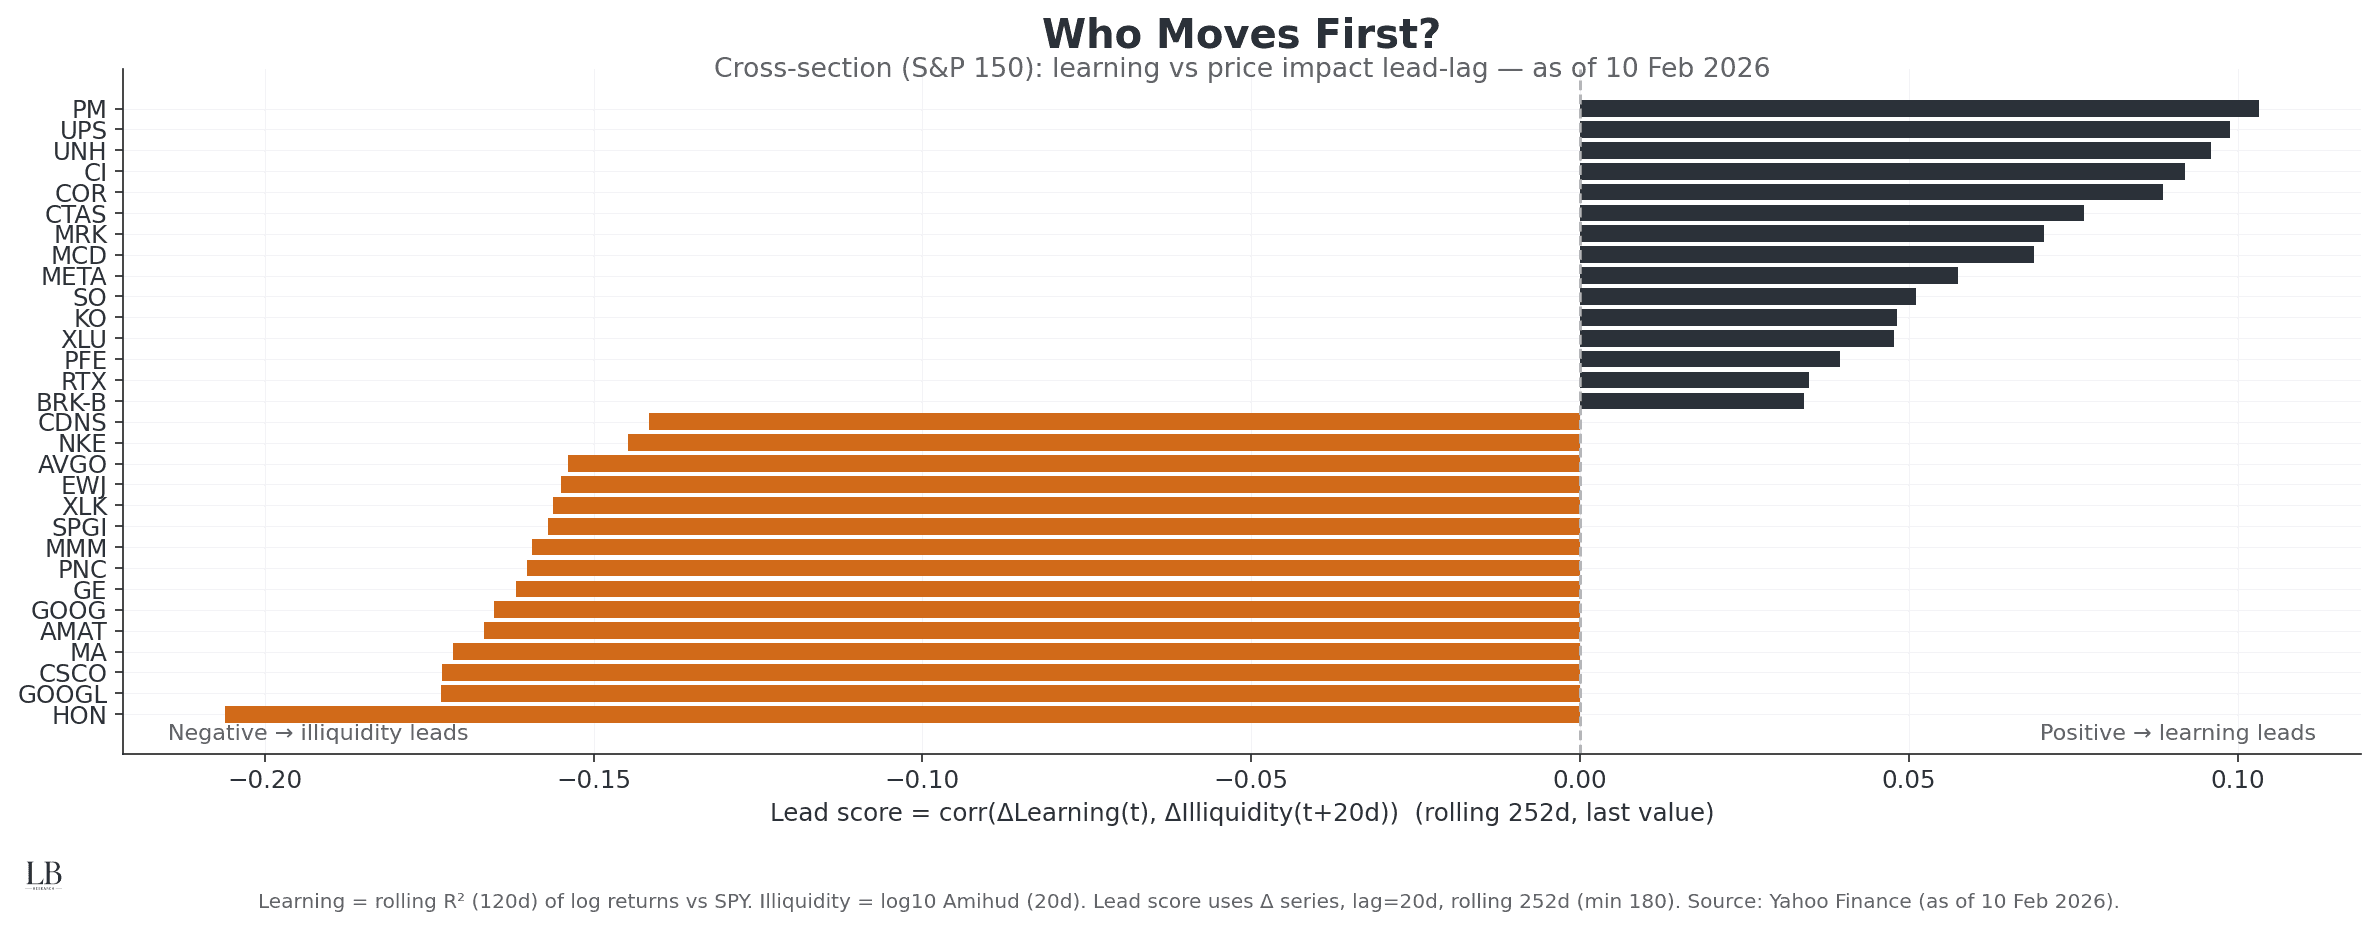
This chart ranks assets by their learning vs illiquidity lead–lag relationship.
Interpretation:
• Positive scores → learning leads execution quality
• Negative scores → illiquidity deteriorates first
What it reveals:
• Defensive and structurally stable names tend to learn first
• Crowded, narrative-heavy assets see liquidity strain earlier
• Leadership is not random, it reflects structure, not size
Liquidity stress is not evenly distributed.
It emerges where learning and positioning collide.
The Structural Read
Across all four views, the conclusion is the same:
• liquidity is not volume
• execution is not instantaneous
• learning is fast
• adjustment is slow
Markets do not fail when signals appear.
They fail when execution cannot keep up.
Liquidity is not a condition.
It is a learning problem.
Methodology
• Universe: S&P 150
• Prices: daily close
• Returns: log returns
• Learning: rolling R² vs SPY (120D window, min 90 obs)
• Illiquidity: log10 Amihud price impact (20D)
• Dispersion: cross-sectional IQR of R²
• Lead–lag: correlations of Δ series (lag = 20D, rolling 252D)
• Smoothing: light rolling mean for visual clarity
• Event windows: major stress regimes for alignment
• Source: Yahoo Finance
• Analysis: Laura Brennan


