
Liquidity Isn’t Volume
Why Trading Activity Can Mask Structural Fragility
Markets often look liquid when trading activity is high.
But liquidity is not turnover.
It is absorption.
This Insight separates how much trades from how easily trades clear, using simple price-impact measures across equities and credit.
Across cycles, the message is consistent:
liquidity thins before volatility confirms it.
Liquidity Isn’t Volume
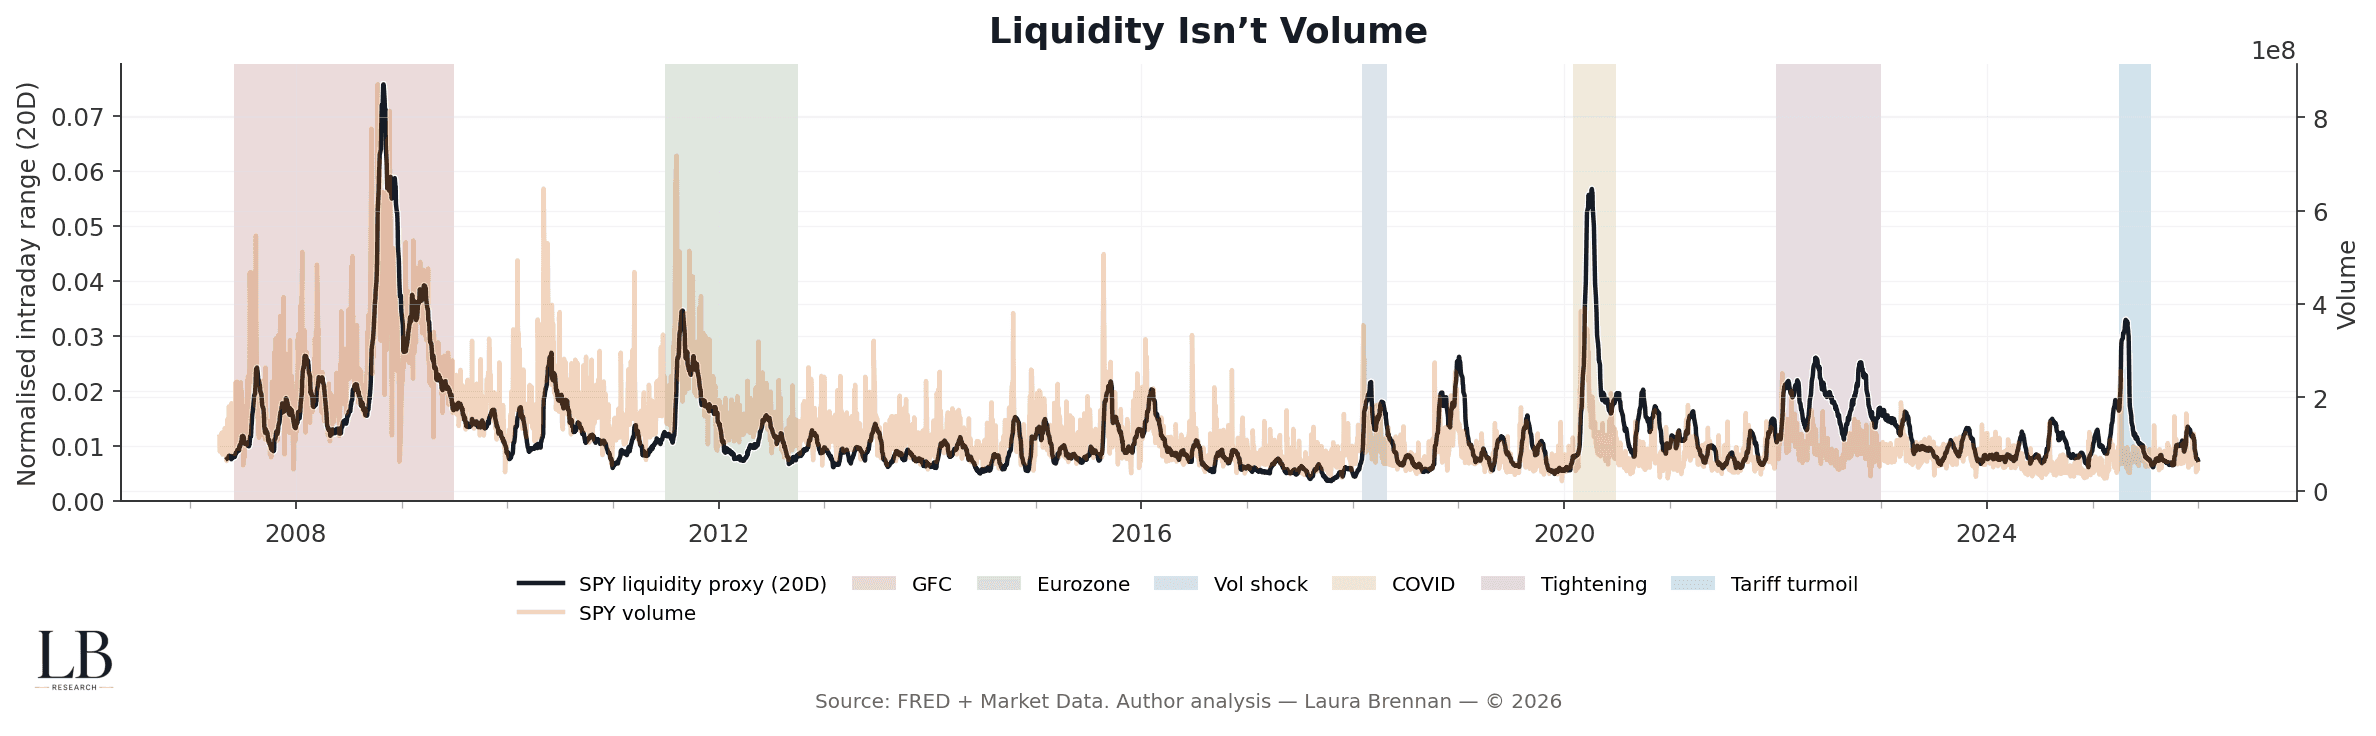
SPY intraday range (20-day average)
SPY trading volume
With event bands
This chart contrasts trading activity with a basic liquidity proxy.
What matters is not whether volume is high.
It is whether price moves through volume or because of it.
• Rising volume without widening ranges implies functioning depth
• Widening ranges alongside heavy volume indicate reduced absorption
• Liquidity stress can build even when markets appear active
• The signal persists across multiple stress regimes
High turnover can coexist with fragile market depth.
Trading Without Absorption
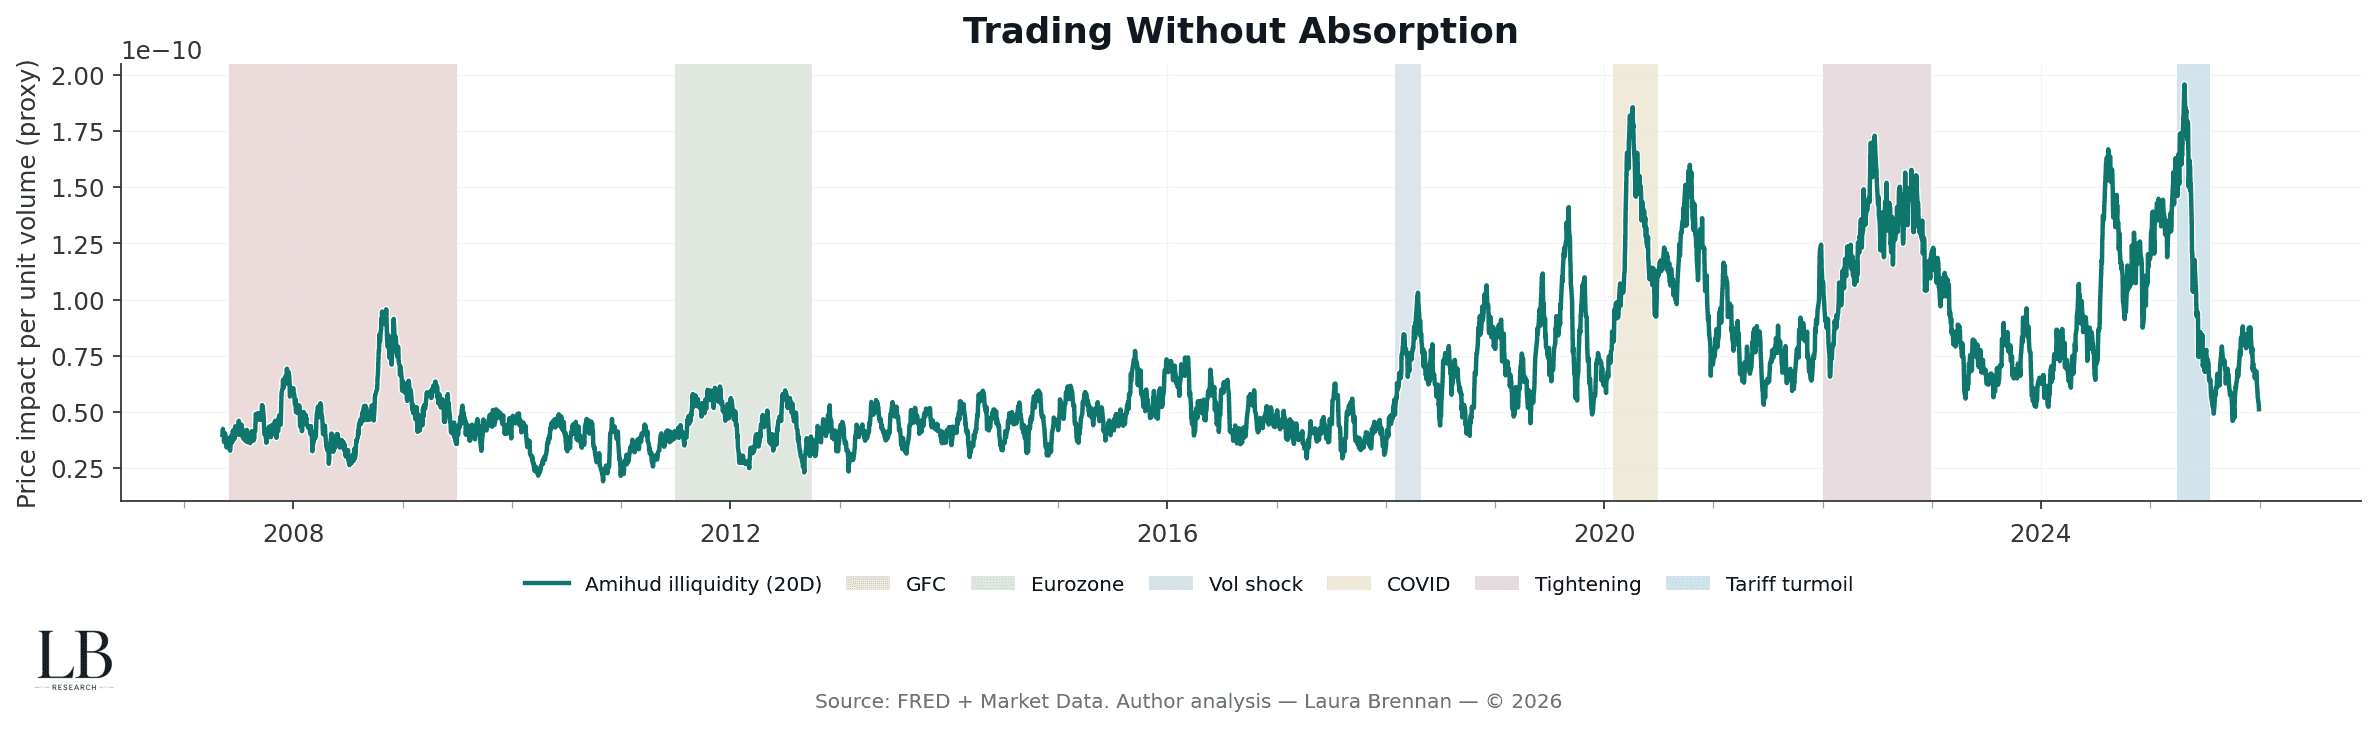
Amihud-style illiquidity proxy (20-day average)
With event bands
This chart reframes liquidity stress in terms of price impact per unit volume.
Rather than asking how much trades, it asks:
how costly is it to trade?
• Illiquidity rises well before volatility spikes
• Stress regimes show persistent elevation, not single shocks
• Post-2020 liquidity conditions remain structurally tighter than prior cycles
Markets can remain orderly while becoming harder to move through.
Structural Stress Without Volatility Confirmation
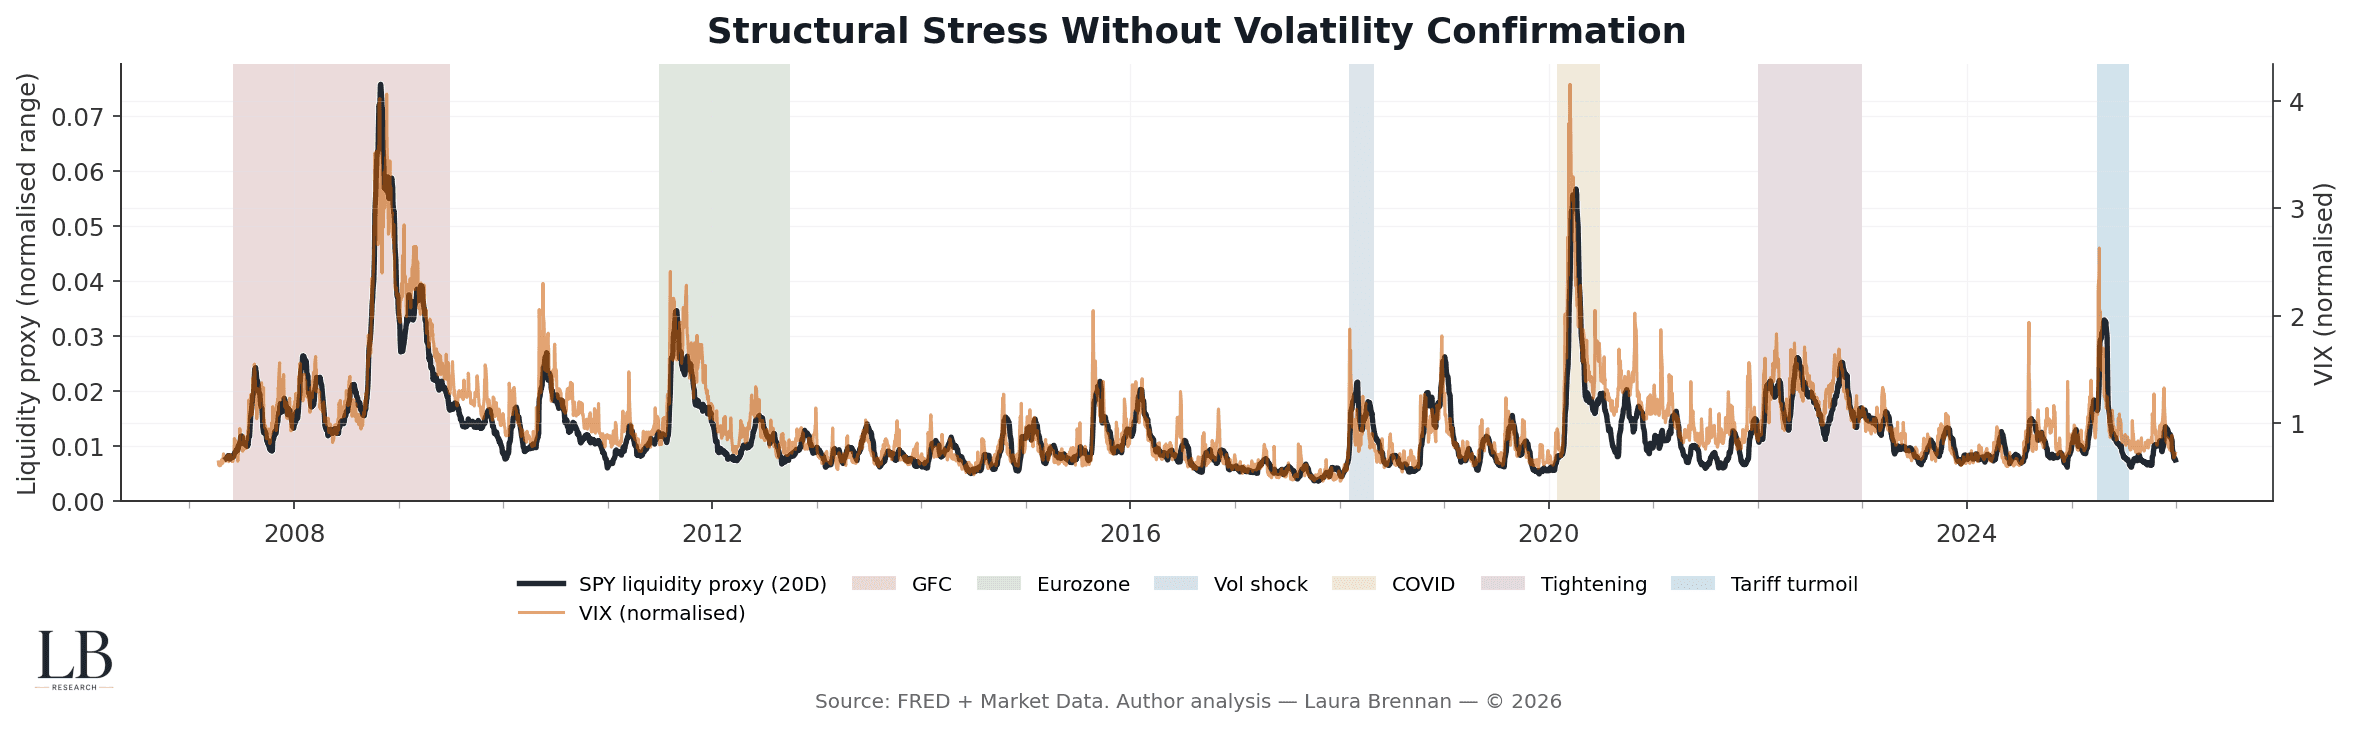
SPY liquidity proxy (20-day intraday range)
VIX (normalised)
With event bands
This chart shows why volatility alone is an incomplete stress signal.
• Liquidity deterioration often precedes volatility spikes
• VIX can remain muted while price impact rises
• The gap reflects tightening positioning beneath the surface
• Volatility tends to confirm stress after liquidity has already shifted
Calm volatility does not imply stable market structure.
Credit Trades, Liquidity Thins
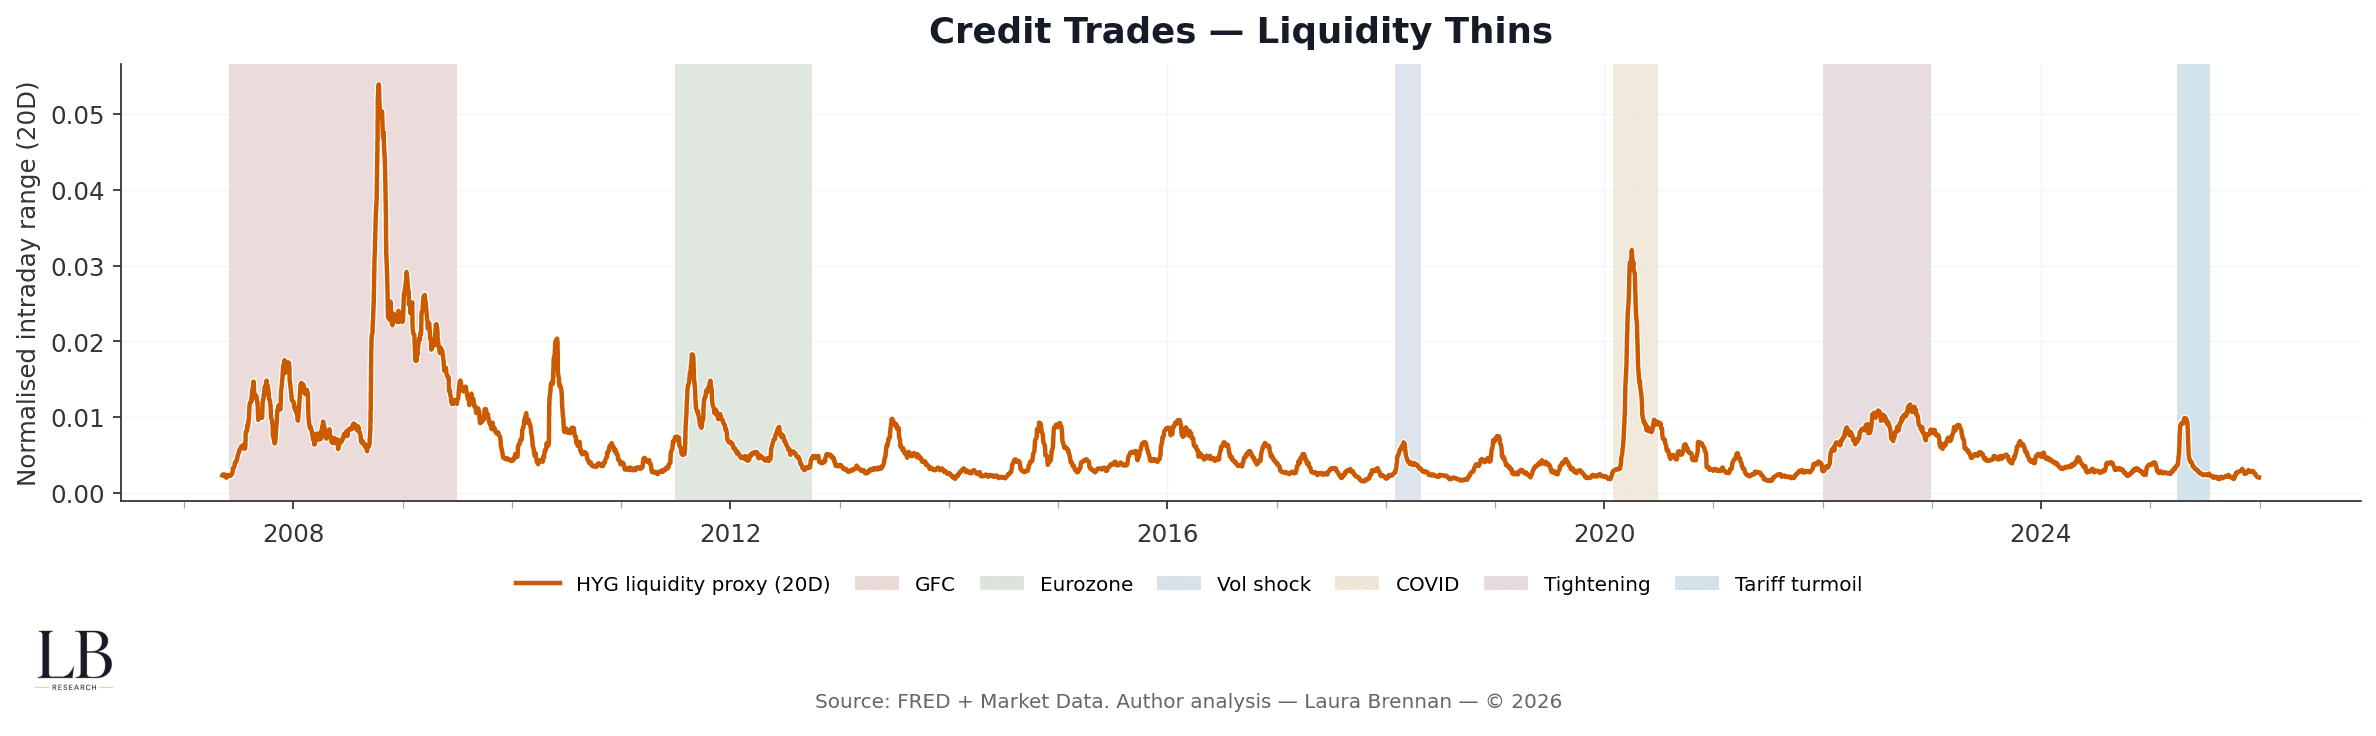
HYG intraday range (20-day average)
With event bands
Credit markets tend to show liquidity stress earlier and more persistently.
• Liquidity spikes are sharper and slower to mean-revert
• Stress clusters around funding and policy transitions
• Credit depth weakens even when equity markets appear resilient
When liquidity thins in credit, risk transmission is rarely far behind.
The Structural Read
Across all four views, the conclusion is the same:
• liquidity stress builds before volatility reacts
• volume is a poor proxy for depth
• absorption deteriorates quietly, then suddenly
• market calm can reflect delayed repricing, not stability
Understanding liquidity as structure, not activity, changes how stress regimes are read.
Methodology
• Daily data
• Equity proxy: SPY
• Credit proxy: HYG
• Liquidity proxy: normalised intraday range
• Illiquidity proxy: Amihud-style price impact
• Smoothing: 20-day rolling averages
• Volatility comparison: VIX (normalised)
• Event windows: major stress regimes for visual alignment
• Sources: FRED + market data
• Analysis: Laura Brennan


