
Quiet Vol, Loud FX
When Currency Markets Signal Stress Before Equities Do
Equity volatility often gets the headlines.
FX volatility usually gets the warning shot.
Foreign exchange markets absorb macro stress earlier than equities because they sit at the intersection of rates, capital flows, trade, and policy credibility.
When FX volatility rises while equity volatility remains subdued, the system is rarely as calm as it appears.
This Insight decomposes the FX–equity volatility relationship into four structural layers:
• Relative volatility levels – FX vs equity calm
• The hidden spread – where stress diverges from price
• Lead–lag dynamics – who moves first
• Dispersion – whether stress is systemic or localised
Together, they form a structural read of cross-asset fragility that sits beneath realised returns, sentiment, and index-level calm.
Quiet Vol, Loud FX
VIX vs G7 FX Realised Volatility (Z)
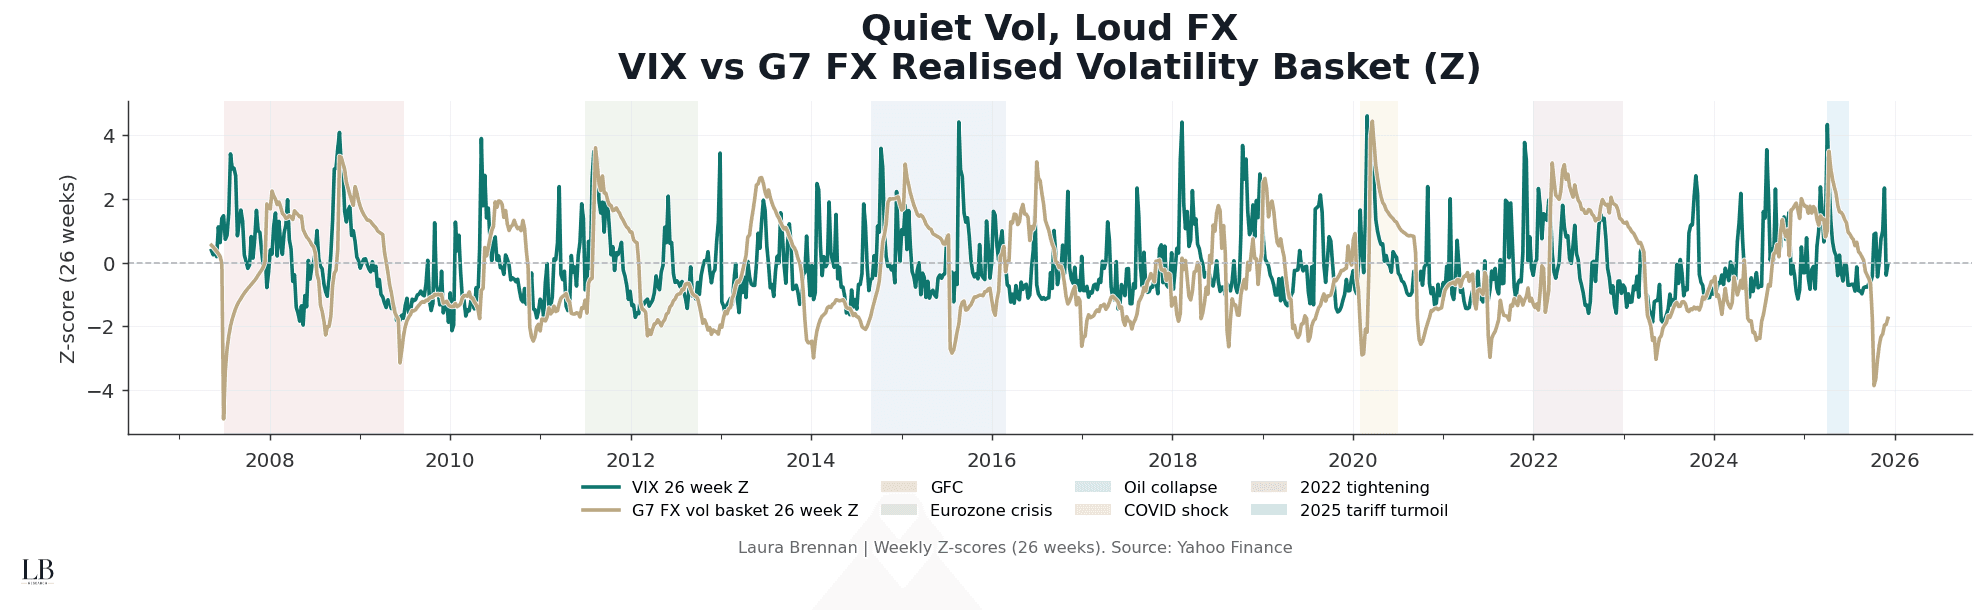
This chart compares equity volatility (VIX) with a realised volatility basket across G7 FX pairs, both expressed as 26-week z-scores.
Most of the time, FX and equity volatility move together.
That alignment reflects a stable macro environment where risk is priced consistently across assets.
When they diverge, the system is signalling something else:
• macro stress building outside equities
• rate, policy, or trade uncertainty leaking first into FX
• hedging demand rising before equity repricing
• capital flow stress not yet visible in index volatility
Across the long sweep:
• 2007–09: FX and equity vol spike together through the GFC
• 2011–12: FX volatility remains elevated as equity stress grinds on
• 2015–16: oil and EM spillovers push FX vol ahead of equities
• 2020: synchronized extremes during COVID
• 2022: policy tightening lifts FX volatility persistently
• 2025: tariff turmoil triggers FX stress while equity vol stays selective
FX does not need to explode to matter.
It only needs to stop agreeing with equities.
Where Stress Hides
FX Vol − VIX Spread (Z)
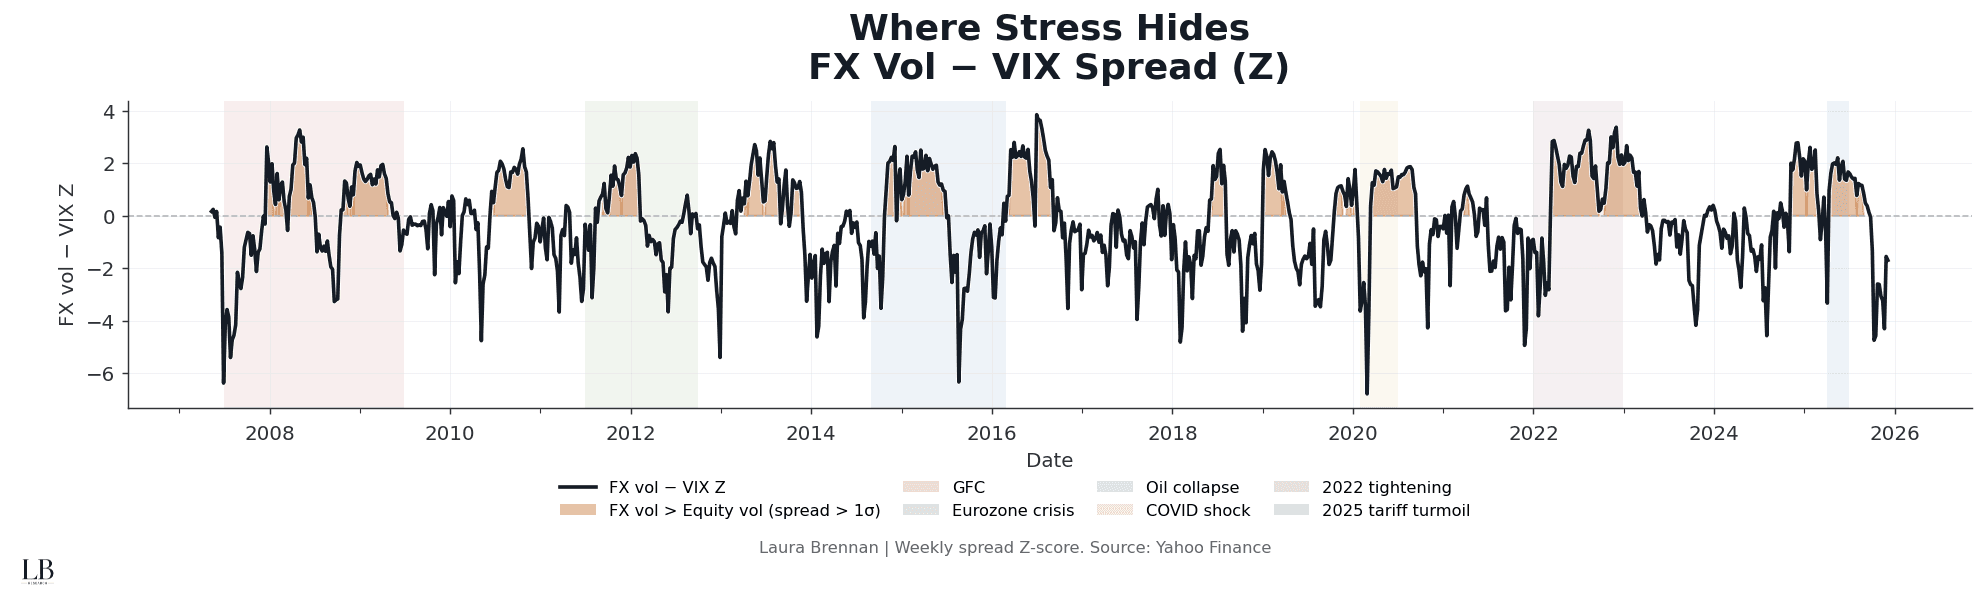
The volatility spread makes the divergence explicit.
By expressing FX volatility minus equity volatility as a rolling z-score, the chart isolates periods where FX stress materially exceeds what equity markets are pricing.
A positive spread is not about fear.
It is about pressure:
• pressure from rates and yield differentials
• pressure from policy uncertainty
• pressure from trade and capital flow realignment
• pressure from hedging demand outside equities
Highlighted pockets show when FX volatility exceeds equity volatility by more than one standard deviation.
These episodes often precede:
• equity volatility catch-up
• regime shifts in correlations
• changes in market leadership
• sudden narrative reversals
Stress rarely announces itself loudly.
It tends to hide where fewer people are looking.
Who Leads the Volatility Cycle?
Rolling FX Vol vs VIX Lead–Lag Correlation
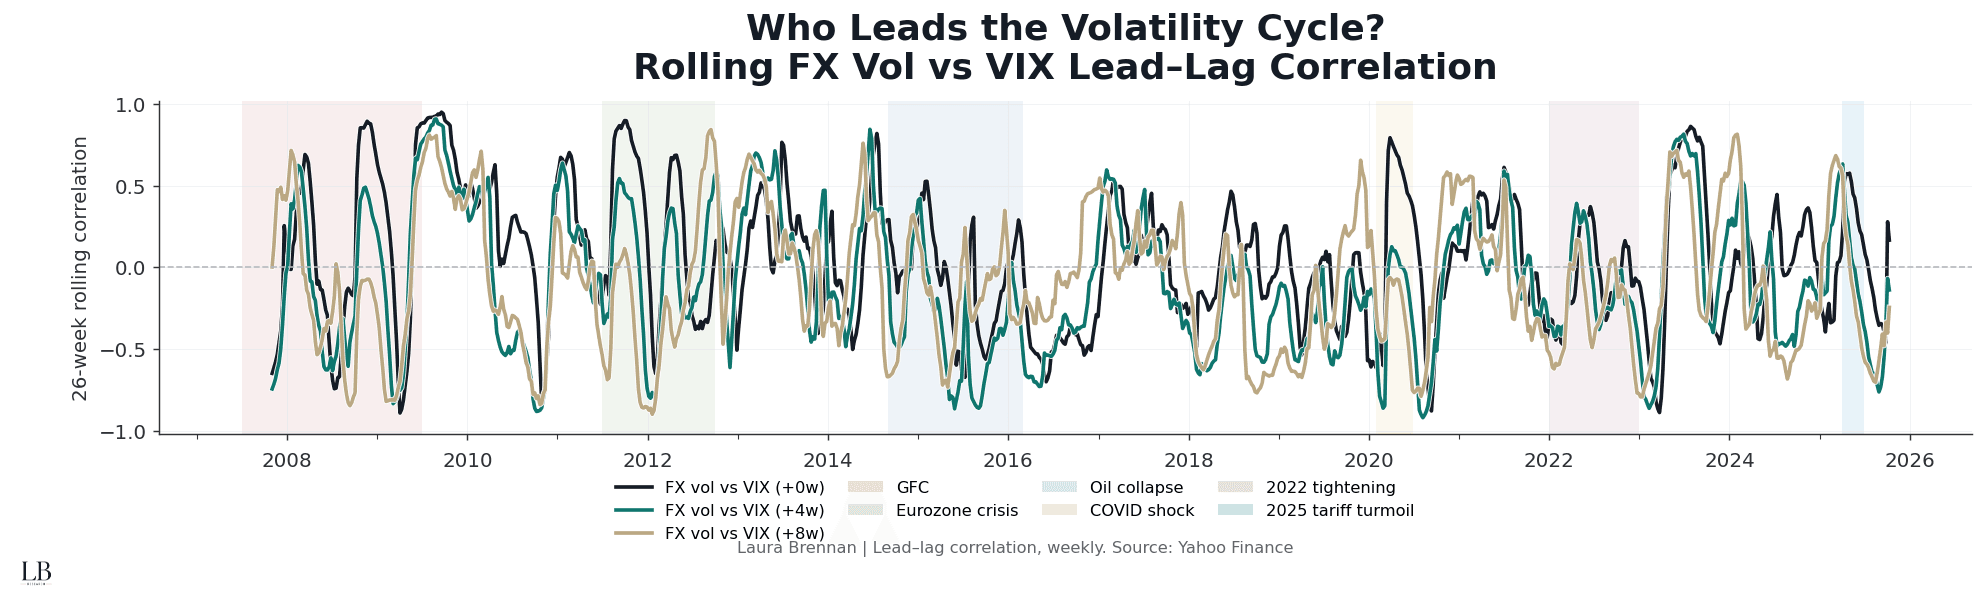
This chart examines whether FX volatility leads or follows equity volatility.
Rolling correlations are computed between FX volatility and VIX at three horizons:
• contemporaneous
• FX leading by 4 weeks
• FX leading by 8 weeks
The pattern is not stable, and that instability is the signal.
Across regimes:
• crisis periods show tight co-movement
• transition periods show FX leading equities
• calm periods show weak or negative correlation
• policy-driven regimes distort timing relationships
FX does not always lead.
But when it does, it tends to do so before equity narratives adjust.
The breakdown and re-formation of these correlations mark regime change, not noise.
Is FX Stress Systemic?
Cross-G7 FX Volatility Dispersion
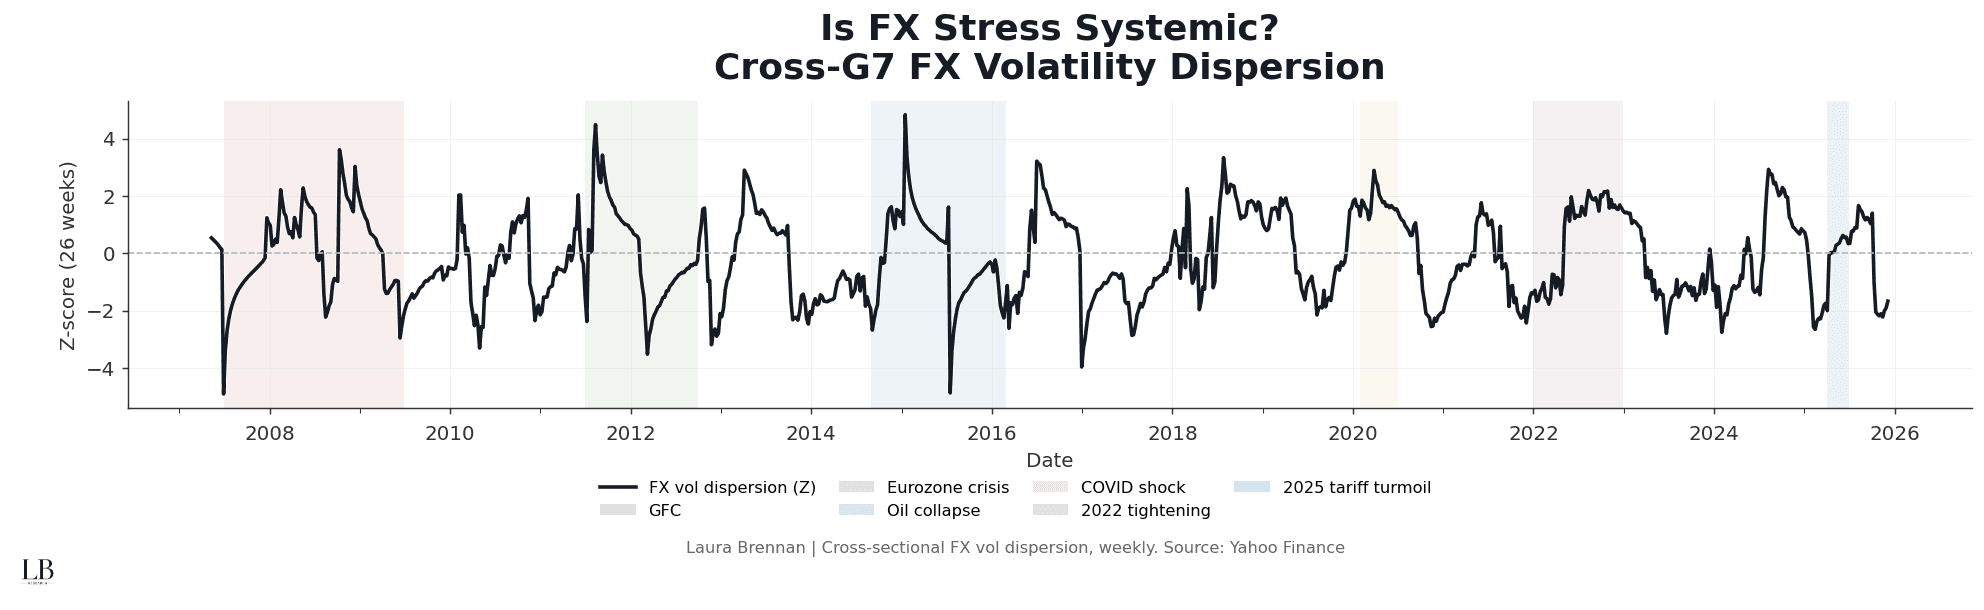
Not all FX stress is global.
This chart measures the cross-sectional dispersion of realised volatility across G7 currencies, expressed as a rolling z-score.
Low dispersion indicates:
• macro stress priced broadly and uniformly
• coordinated policy or global shocks
High dispersion indicates:
• idiosyncratic stress
• regional or policy-specific tension
• fragmentation beneath headline calm
Historically:
• GFC and COVID show systemic FX stress
• Eurozone and oil-led episodes show regional concentration
• recent regimes show oscillation between the two
Dispersion matters because it determines whether stress stays contained or spreads.
The Structural Read Today
Across all four layers:
Relative volatility:
FX volatility has repeatedly lifted ahead of equity volatility during recent stress windows.
The spread:
Positive FX–equity divergence continues to appear in short, sharp bursts.
Lead–lag structure:
FX volatility intermittently leads equities, particularly around policy and trade events.
Dispersion:
Stress remains uneven, suggesting fragmentation rather than full systemic breakdown.
This is not a stable equilibrium.
It is a market repeatedly testing where stress belongs.
Equity calm does not imply macro calm.
FX is already saying that out loud.
Methodology
• Daily G7 FX spot rates and VIX (Yahoo Finance)
• Realised FX volatility computed over a 130-day window
• Weekly sampling (Friday close)
• 26-week rolling z-scores
• Lead–lag correlations at 0, 4, and 8 weeks
• Cross-sectional dispersion across G7 FX vols
• Event windows applied ex-post (GFC, Eurozone crisis, Oil collapse, COVID, 2022 tightening, 2025 tariff turmoil)
• Analysis by Laura Brennan


