
Sector Synchronicity Pulse
When Equity Structure Shifts Beneath the Surface
Market structure moves long before price does.
One of the earliest ways to see that shift is through sector synchronicity, the degree to which MSCI sectors begin to move together, lock in, or fracture.
It is a structural temperature check on how coordinated, or how brittle, global equity risk has become.
This Insight decomposes the sector-ACWI relationship into four layers:
The synchronicity pulse, the system-level read
Dispersion, when the architecture begins to fracture
Leadership, who locks in first, who follows
Regime behaviour, how sectors behave inside stress windows
Together, they provide a structural map of equity risk, separate from sentiment, headlines, and noise.
The Pulse: When MSCI Sectors Move as One
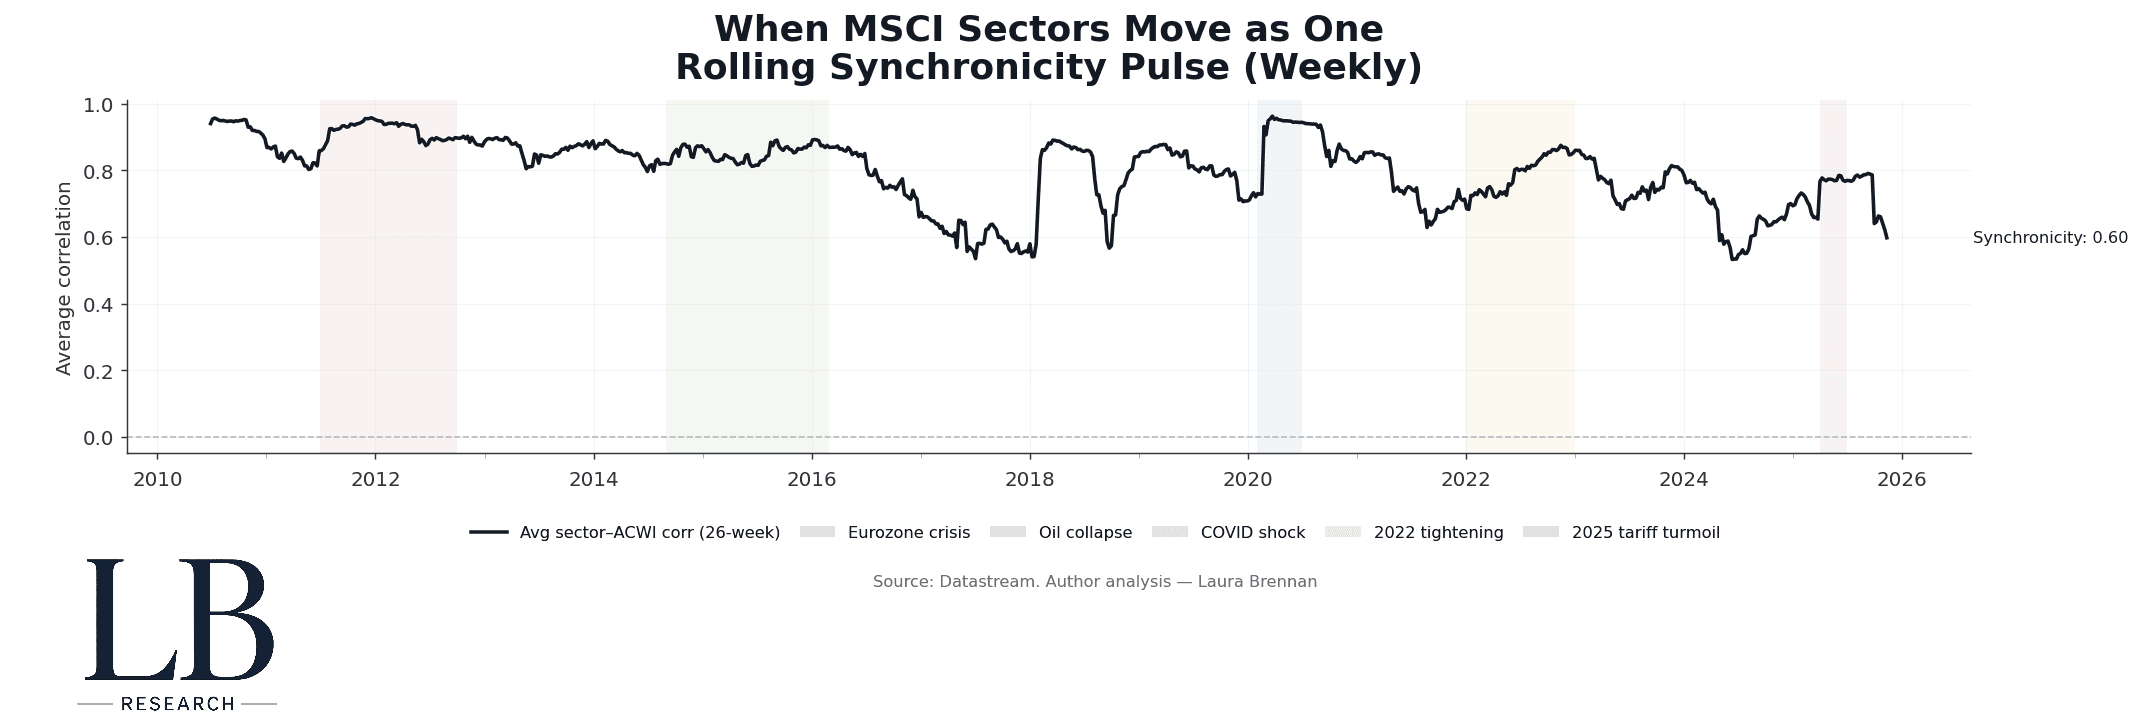
The synchronicity pulse tracks the average 26-week correlation between MSCI sectors and ACWI, a slow-moving but powerful structural measure.
A rising pulse signals co-movement, herding, regime alignment, or liquidity-driven convergence.
A falling pulse signals differentiation, rotation, dispersion, or structural adjustment.
Current read: ~0.60
This is neither extreme compression nor healthy differentiation. It is a mid-cycle structure that can break either way.
What stands out in the long sweep:
2011–12 and 2015–16: classic stress synchronisation, everything moved together.
2018 and 2020: abrupt lock-ins driven by liquidity withdrawal.
2022 tightening: sectors marched in formation as macro became single-factor again.
2024–25: the pulse weakened while pockets of dispersion rose, early architecture stress.
Synchronicity is not sentiment.
It is the scaffolding underneath it.
The Architecture: Synchronicity vs Dispersion

Correlations rising together tell only half the story.
The other half sits in dispersion, the cross-sectional standard deviation of sector correlations with ACWI.
When synchronicity falls but dispersion rises, the system is not disorderly.
It is re-architecting.
This has historically preceded:
factor regime shifts
value–growth rotations
liquidity reallocations
re-pricing of cyclical vs defensive leadership
Recent behaviour shows exactly this:
a soft decline in synchronicity, but a persistent rise in dispersion, particularly through 2024–25.
This is structural adjustment, not chaos.
Leadership: Who Locks In First?
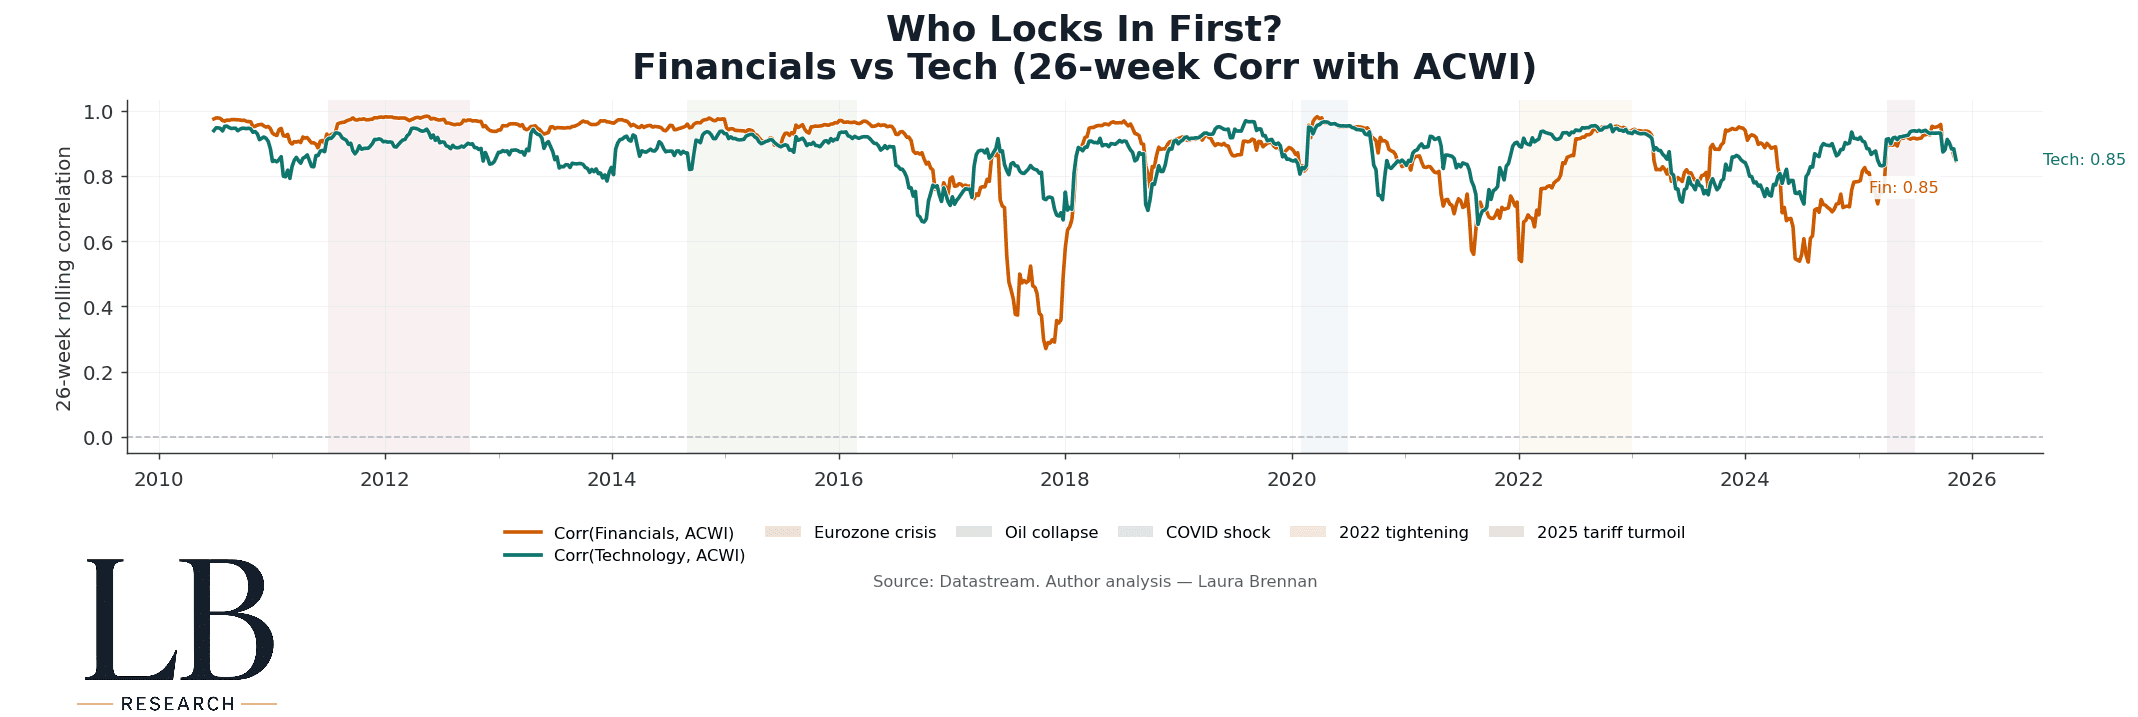
The leadership pattern of sector correlations is remarkably consistent:
Financials lock in first.
They react most quickly to liquidity conditions and credit expectations.Technology locks later, but holds longer.
Once Tech synchronises with the index, it tends to remain attached for longer periods.
The current configuration:
Tech ≈ 0.85
Financials ≈ 0.85
Almost identical readings, but different meanings:
For Financials, 0.85 implies macro-sensitivity.
For Technology, 0.85 implies index dominance.
When these two sectors converge, broad equity risk becomes uni-factor again.
Regime Behaviour: When Sectors Join the Herd
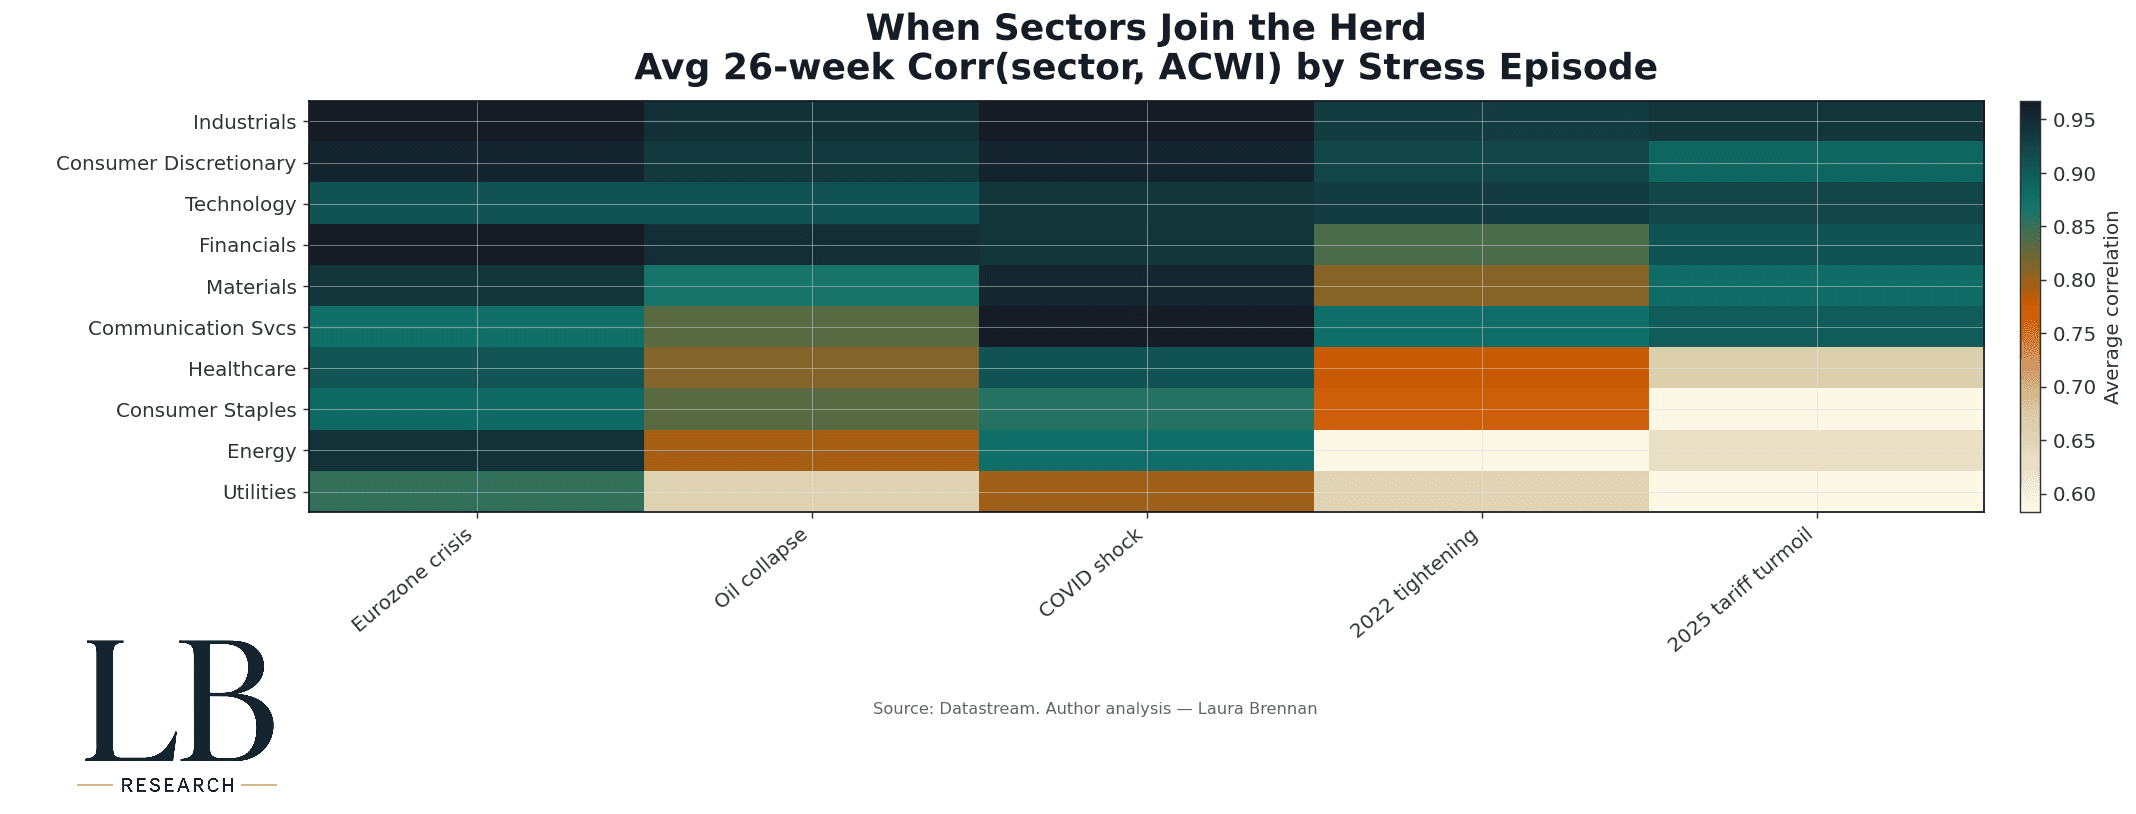
Stress episodes reveal how quickly the architecture locks.
Across the Eurozone crisis, Oil Collapse, COVID, the 2022 tightening cycle, and the 2025 tariff turmoil:
Industrials and Consumer Discretionary are the earliest lockers.
Financials follow immediately.
Technology locks later but tends to remain in synchronised mode.
Defensives (Staples, Healthcare, Utilities) only catch up in deeper stress.
The sector-level behaviour is not random, it is a repeating structural sequence.
This is why event windows matter: they show how the architecture behaves under pressure.
Under the Surface: The Full Rolling Heatmap
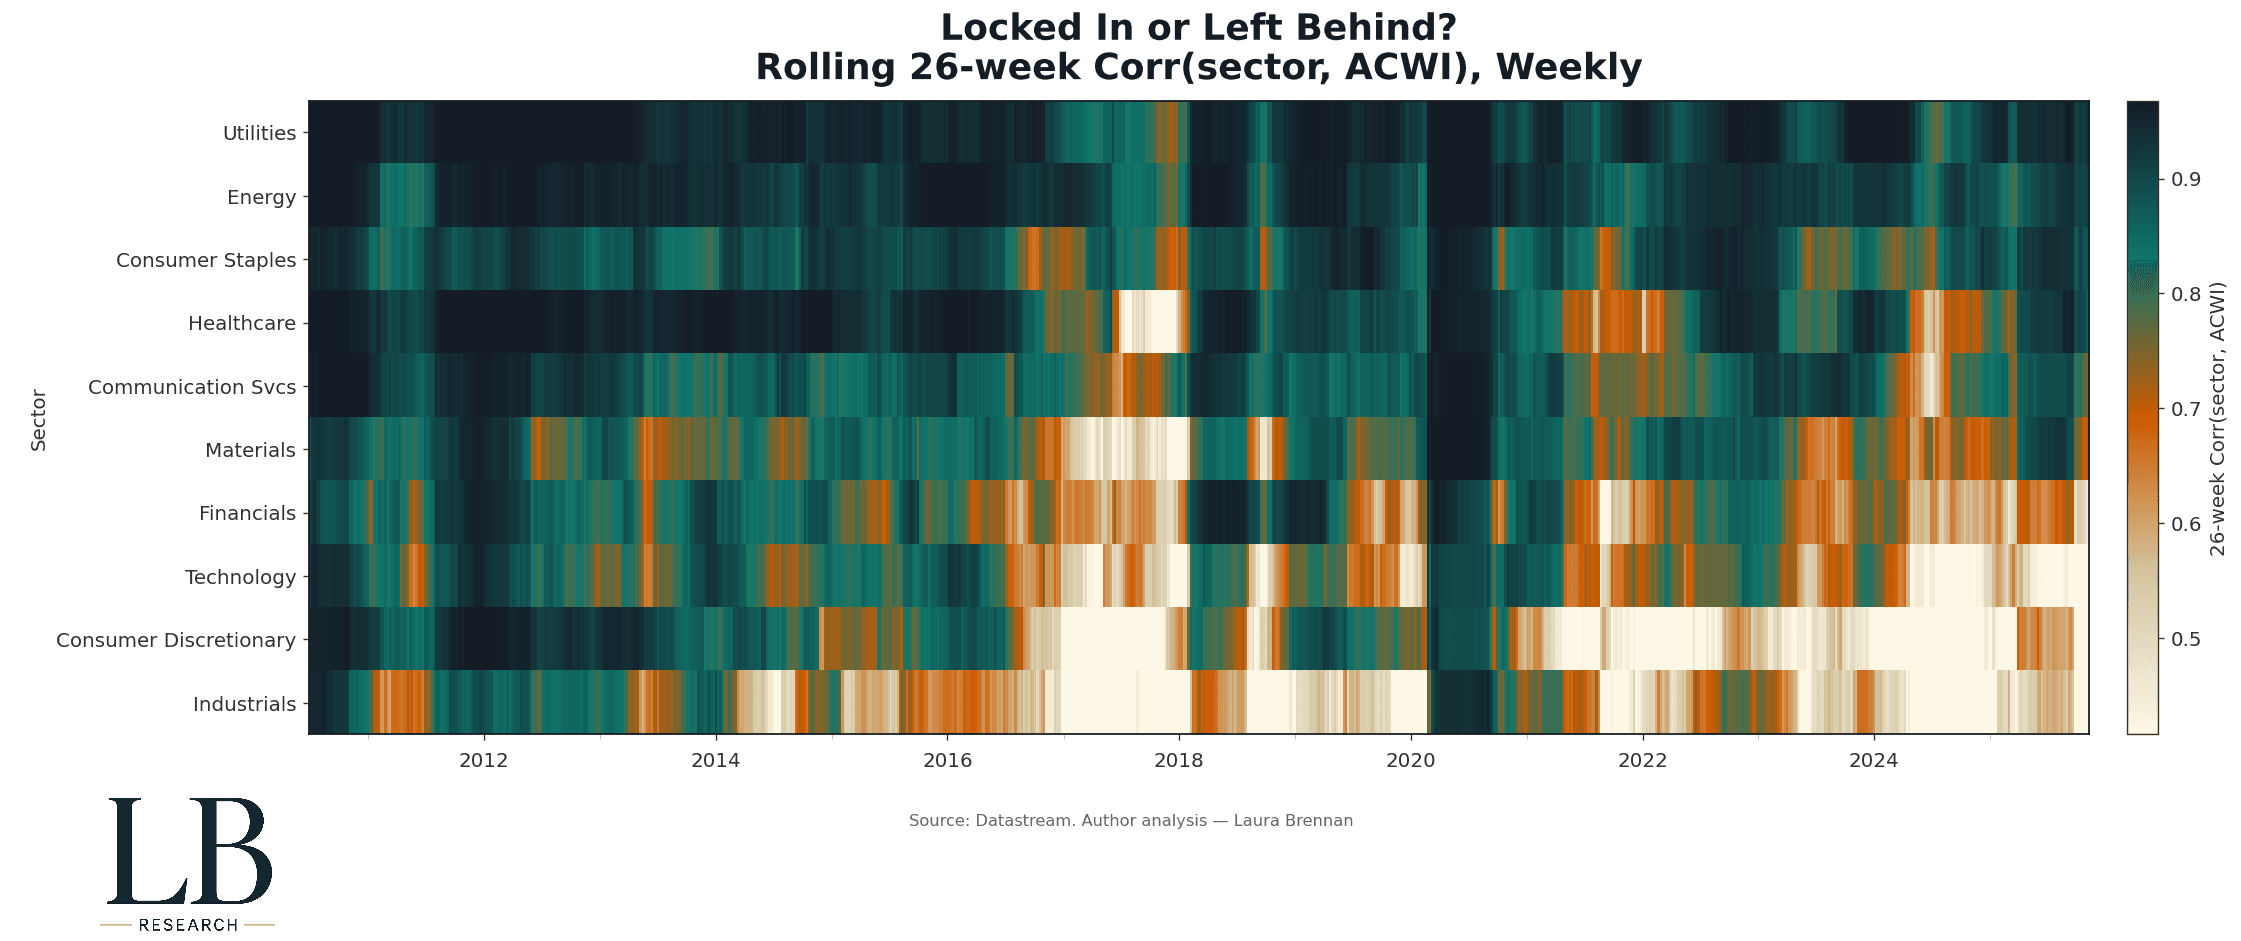
The full rolling 26-week heatmap makes the micro-dynamics explicit.
It shows:
the periodic clustering of entire sectors
transition zones where dispersion temporarily rises
rotations that precede macro turning points
the deep synchronisation phases where everything becomes macro-only
You can see the system breathe.
This is the raw material from which the pulse, dispersion, and leadership signals derive.
The Structural Read Today
Across all four layers:
Synchronicity sits at ~0.60, mid-tier, neither stressed nor relaxed
Dispersion is rising, the architecture is shifting
Financials and Technology are jointly elevated, pointing to a single dominant macro driver
Cyclical sectors locked earliest in recent episodes, similar to 2011, 2015, and 2022
This is a pre-transition structure, not a stable one.
When structure tightens, markets can rally indiscriminately.
When structure fractures, leadership reshuffles.
Right now, the system sits in between.
Methodology
Weekly MSCI sector and ACWI data
26-week log-return correlations
Dispersion measured as cross-sectional σ of sector–ACWI correlations
Stress windows applied ex-post (Eurozone crisis, Oil Collapse, COVID shock, 2022 tightening, 2025 tariff turmoil)
All data via Datastream
Analysis by Laura Brennan, LB Research


