
US Systemic Banks
When the System Collapses into One Trade
Markets do not become fragile because volatility spikes.
They become fragile when dispersion collapses and synchronisation dominates.
This Insight examines how tightly US systemic banks move together, how that structure evolves across regimes, and what happens when disagreement disappears.
Across cycles, one pattern repeats: synchronisation rises before stress becomes visible.
System Synchronisation
When banks stop trading as individual institutions
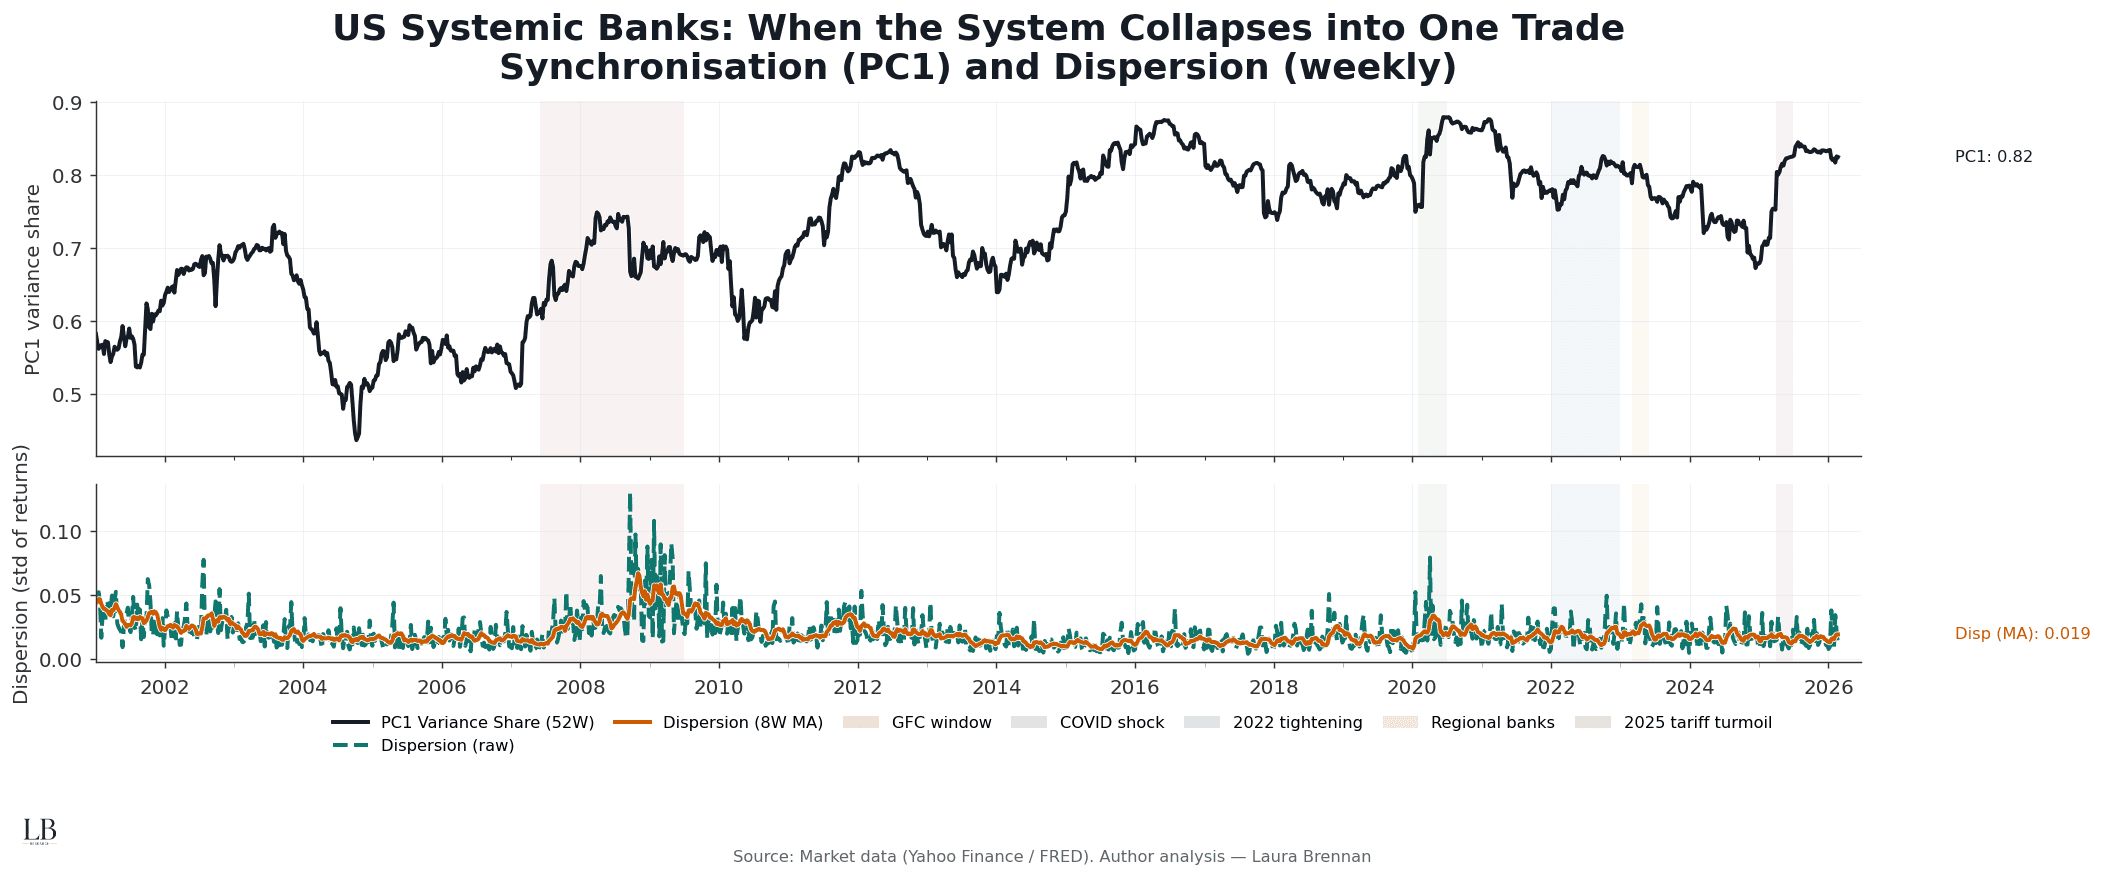
This chart measures rolling PC1 variance share (52W) across US systemic banks, alongside cross-sectional dispersion.
PC1 captures the proportion of return variance explained by the first common factor.
What it shows:
• Synchronisation rises structurally after 2008
• High-regime states (≥ 0.75) now persist longer
• Transitional regimes shrink over time
• Calm periods no longer imply independence
Banks increasingly trade as one system.
Diversification inside the sector weakens before stress is obvious.
Regime Structure
Endogenous synchronisation states
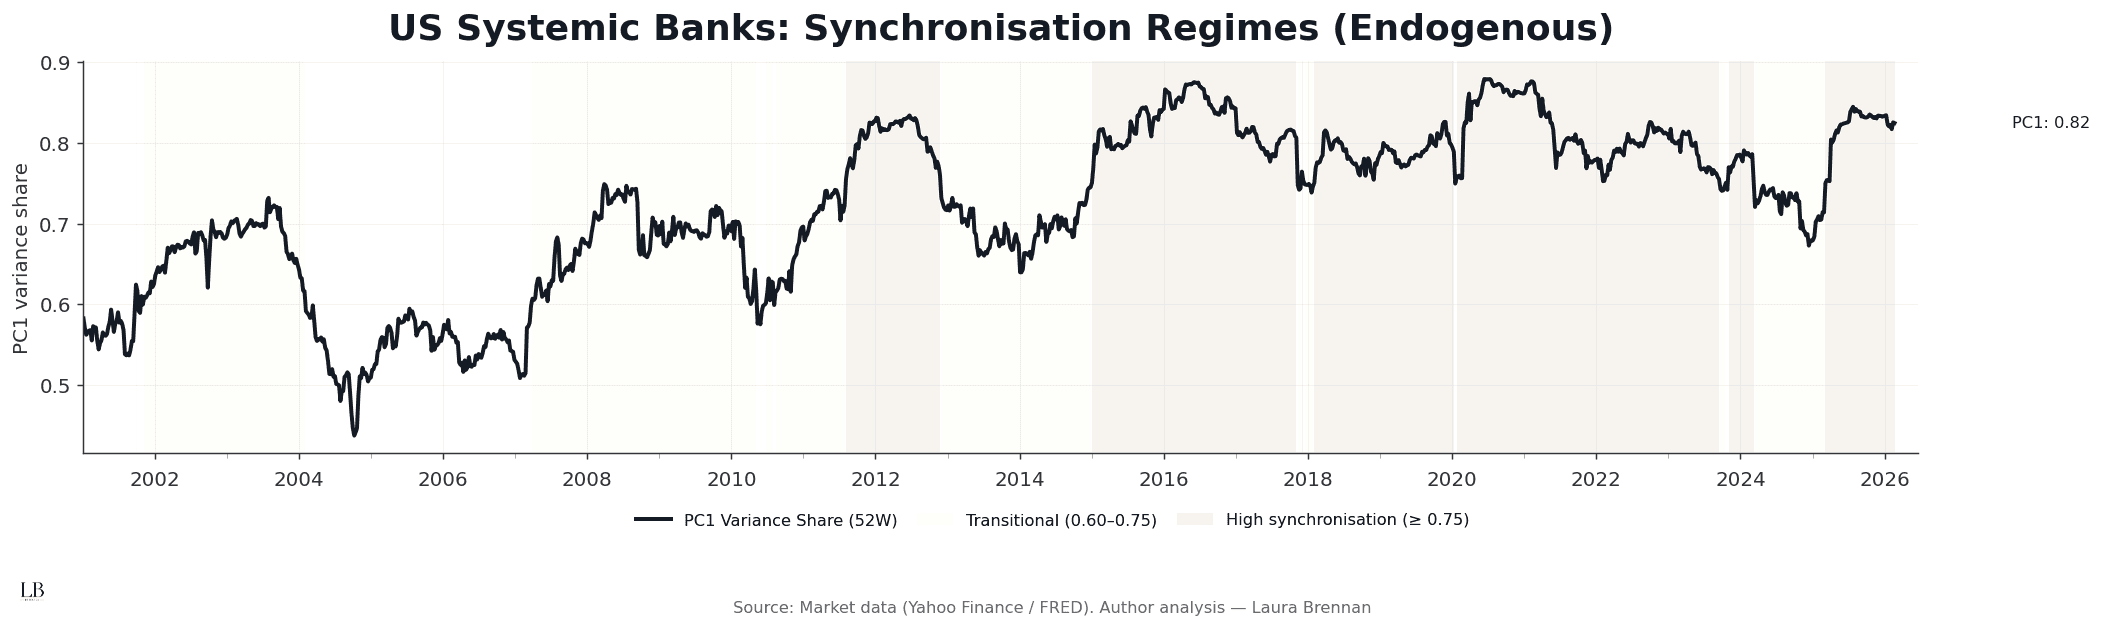
This chart classifies PC1 into three structural regimes:
• Low (< 0.60)
• Transitional (0.60–0.75)
• High (≥ 0.75)
What stands out:
• The system spends more time in high-synchronisation states post-GFC
• COVID was sharp but temporary
• Recent tightening periods show persistent structural coupling
• Current levels remain elevated relative to early 2000s
Stress does not always look extreme.
Sometimes it looks stable but tightly coupled.
Persistence and Normalisation
Synchronisation spikes fast. It fades slowly.
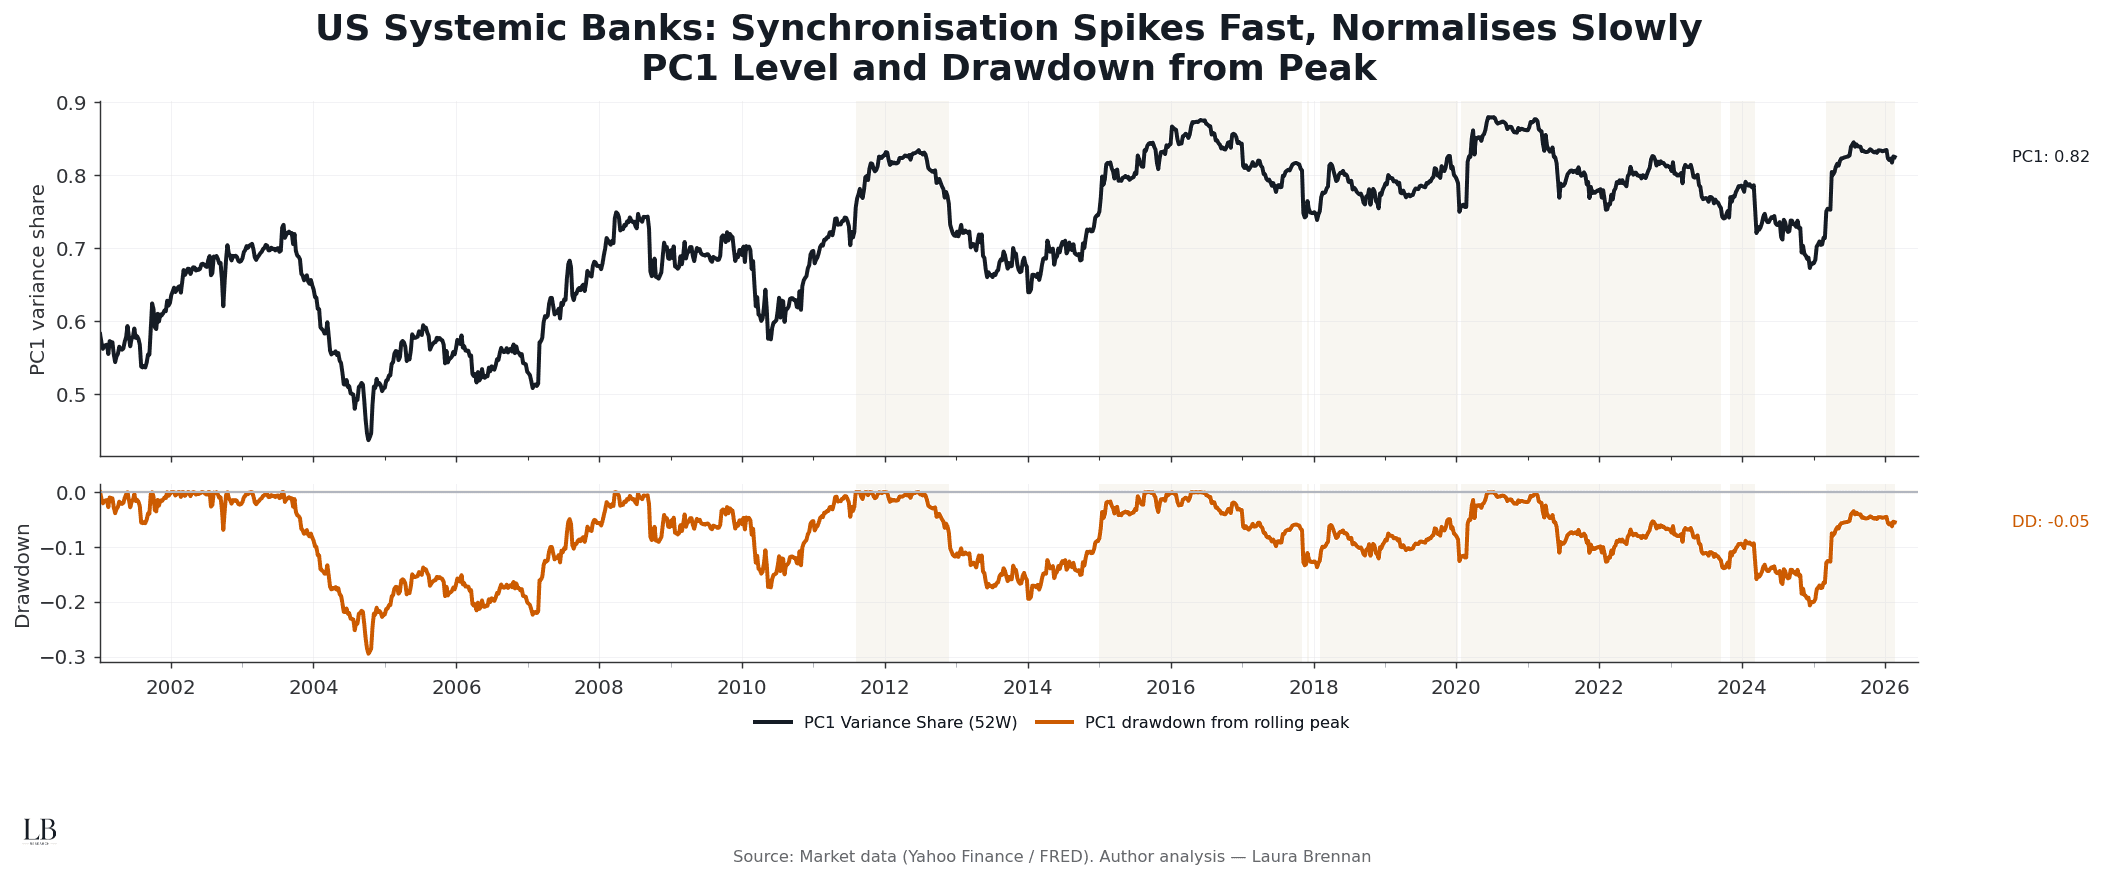
This chart plots PC1 alongside its drawdown from rolling peak.
How to read it:
• PC1 level shows structural coupling
• Drawdown shows how far the system has relaxed
What emerges:
• Spikes occur rapidly during stress
• Normalisation is gradual and incomplete
• High synchronisation states decay slowly
• Structural memory persists beyond volatility
The system resets slower than headlines suggest.
Dispersion Collapse
When disagreement disappears
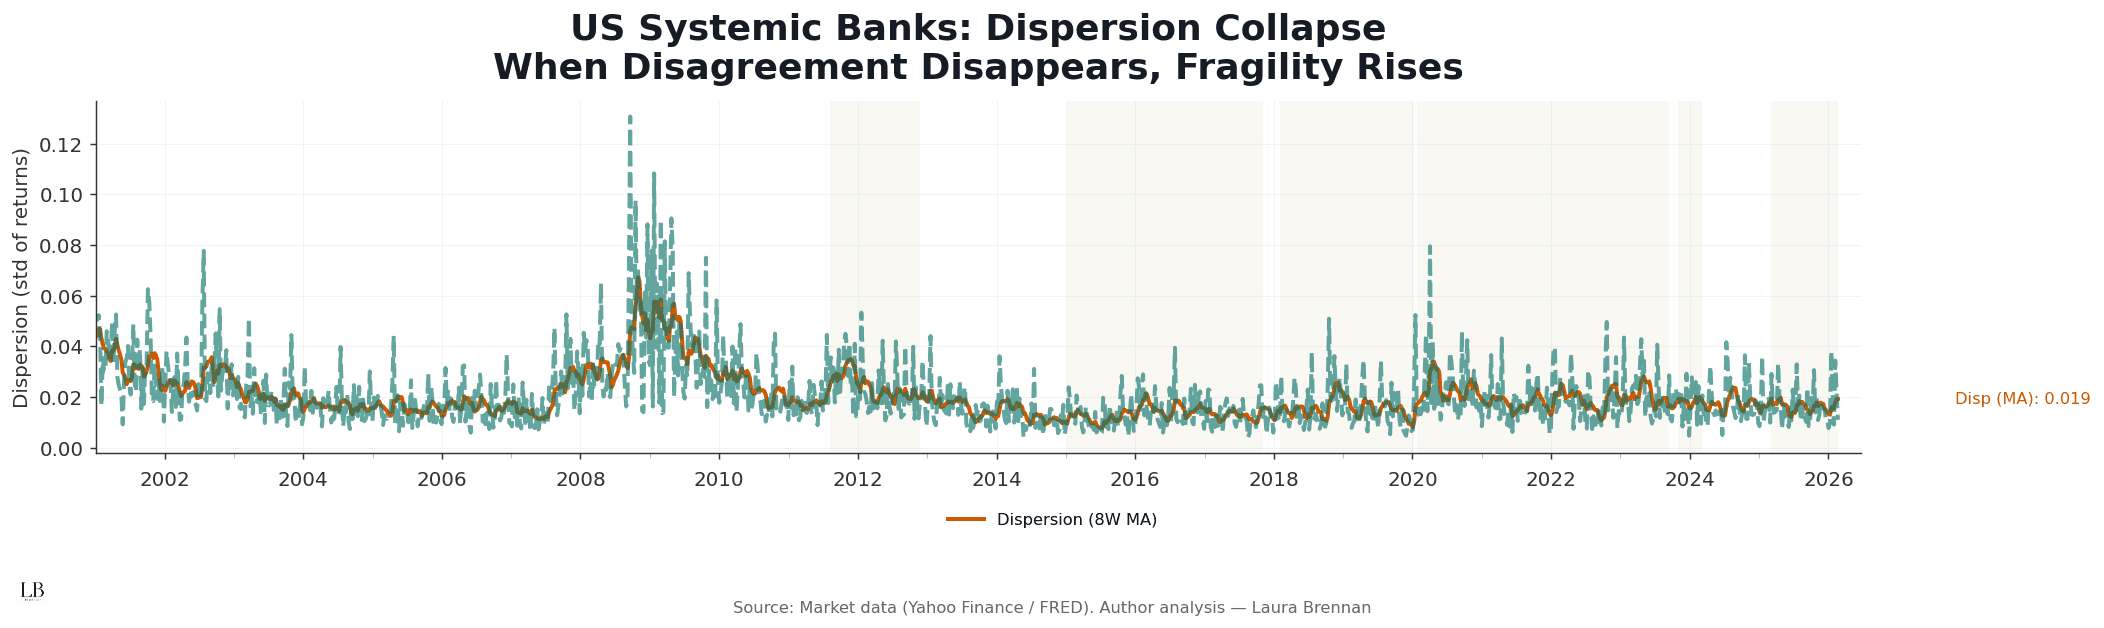
This chart isolates cross-sectional dispersion across systemic banks.
It measures weekly return dispersion (8W smoothed).
What it reveals:
• Dispersion collapses during synchronisation spikes
• High PC1 coincides with compressed disagreement
• Stress begins when dispersion narrows
• Recovery requires dispersion to widen again
Markets do not fail because prices move.
They fail because everything moves together.
The Structural Read
Across all four views, the conclusion is consistent:
• synchronisation rises before visible crisis
• dispersion collapses before volatility spikes
• structural coupling persists after shocks fade
• regime time matters more than event magnitude
Systemic risk is not about one bank failing.
It is about the system trading as one position.
When the system becomes one trade, fragility increases.
Methodology
• Universe: US systemic banks (BAC, BK, C, GS, JPM, MS, PNC, STT, USB, WFC)
• Frequency: weekly (Friday close)
• Returns: log returns
• Synchronisation: rolling PCA (52W window)
• PC1 metric: variance share explained by first component
• Dispersion: cross-sectional standard deviation (weekly, 8W smoothing)
• Regimes: threshold classification (0.60 / 0.75)
• Winsorisation: light 1% tail clip for stability
• Source: Yahoo Finance
• Analysis: Laura Brennan


