
Volatility Lies
Why Calm Markets Can Still Be Structurally Fragile
Markets often look stable when volatility is low.
But volatility is not risk.
It is expression.
This Insight separates how tightly markets move together from how stress is transmitted, showing why calm volatility can coexist with rising fragility beneath the surface.
Across cycles, the message is consistent:
structure tightens before volatility reacts.
Volatility Lies
MSCI World realised volatility (30-day, annualised)
Global coupling: MSCI World ↔ FTSE 100 (30-day correlation)
With event bands
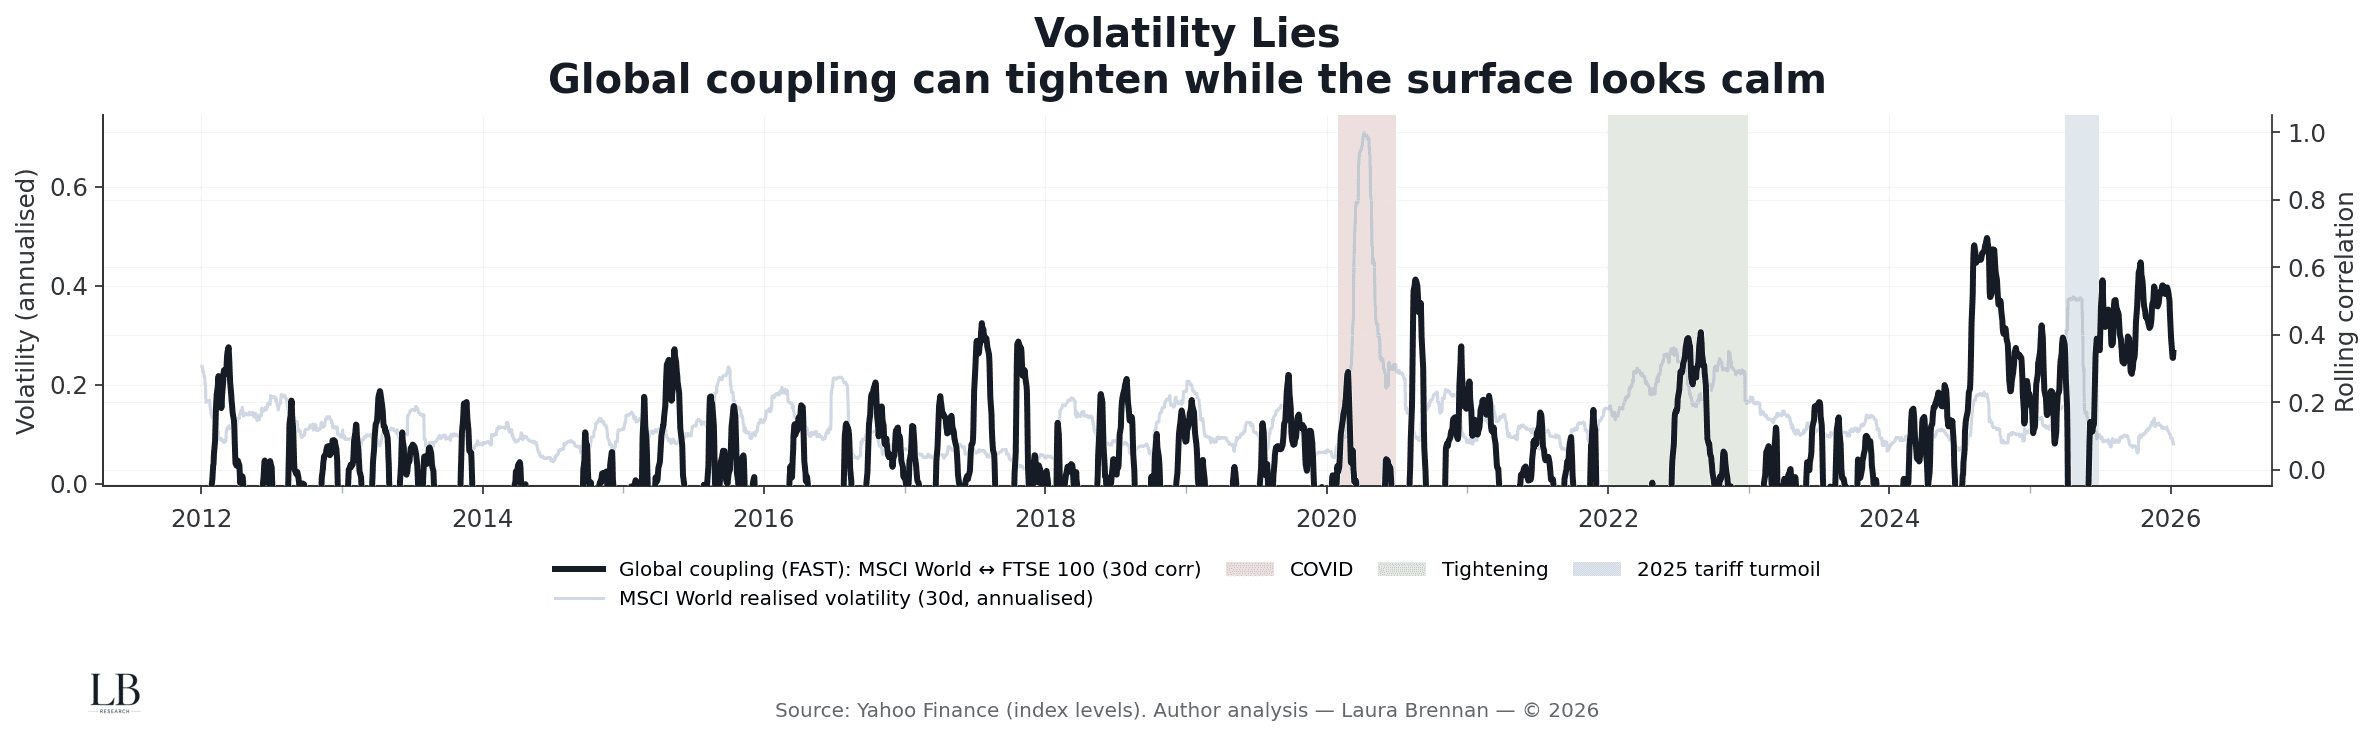
This chart contrasts surface calm with underlying integration.
What matters is not whether volatility is low.
It is whether markets are becoming more synchronised beneath it.
• Global coupling often tightens during low-volatility periods
• Stress transmission can strengthen without price instability
• Calm volatility can reflect delayed repricing, not stability
• Tight coupling increases the system’s vulnerability to shocks
Volatility does not measure fragility.
Connectivity does.
Local Stress Inside a Global System
UK volatility premium: FTSE realised volatility ÷ MSCI realised volatility (30-day)
Global coupling (slow regime filter)
With event bands
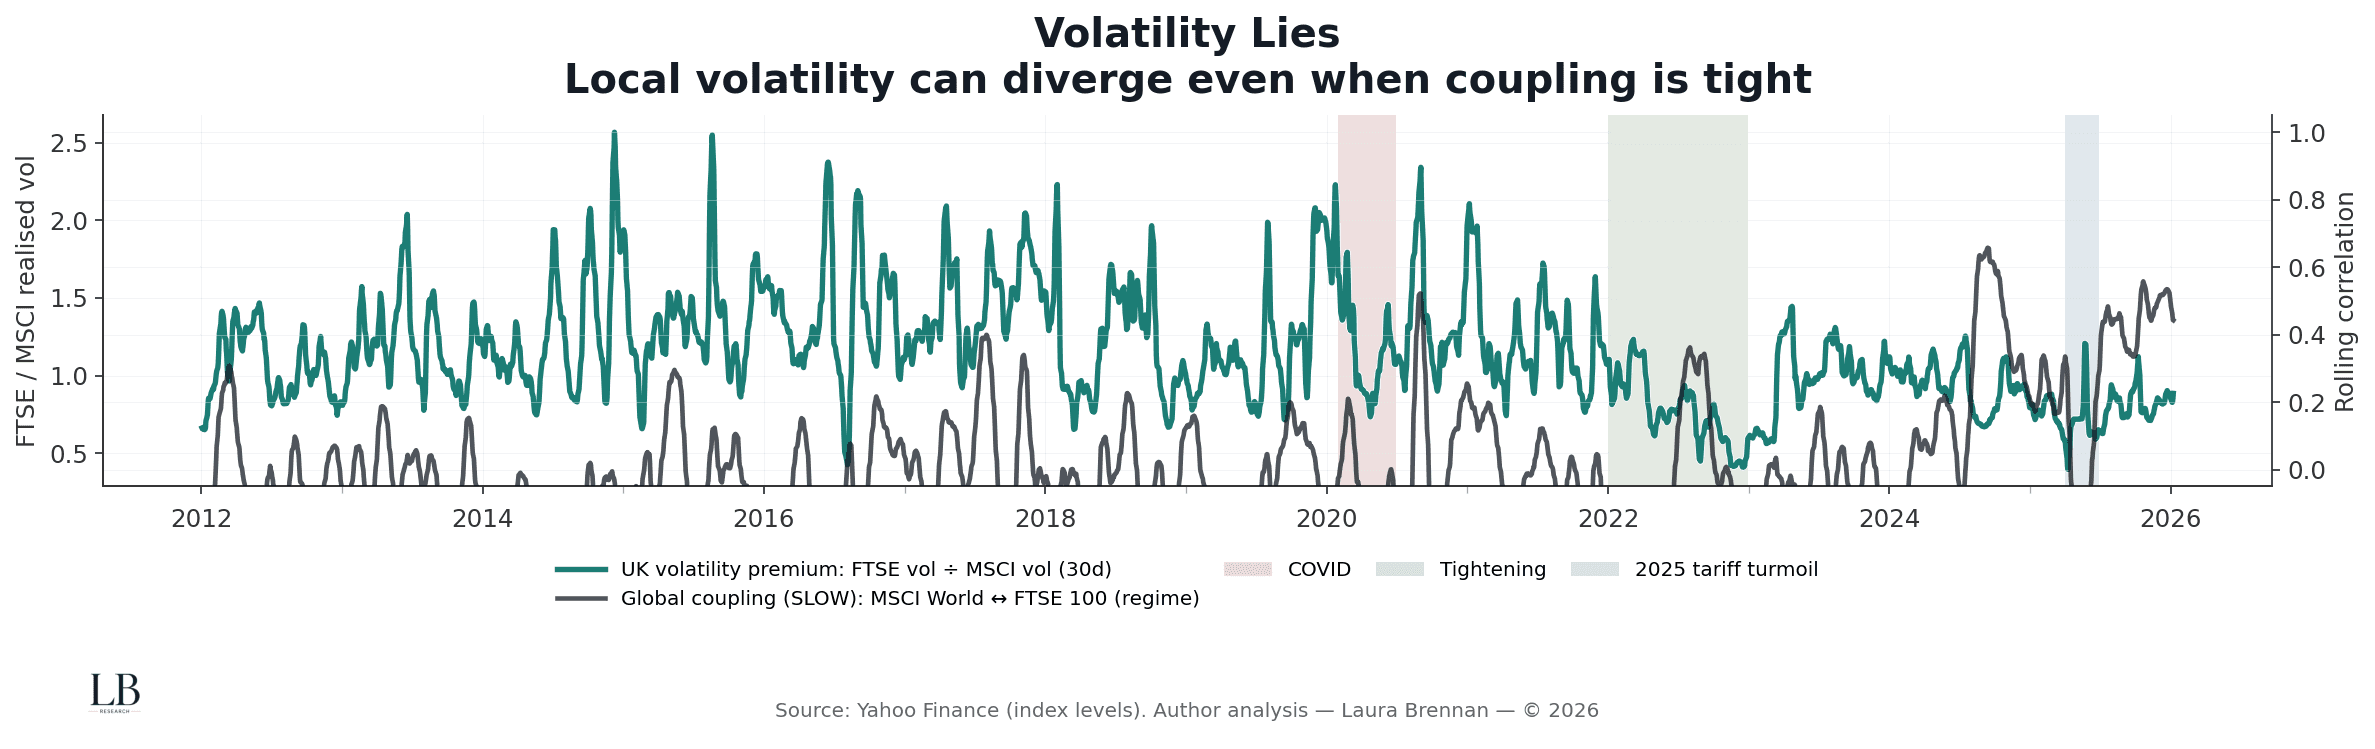
This chart shows how local market stress can diverge even when global coupling remains tight.
Global markets may move together, but local risk is not evenly distributed.
• Local volatility can rise independently of global benchmarks
• Tight coupling does not imply uniform stress absorption
• National markets can experience disproportionate fragility
• Regime shifts alter how stress is expressed, not whether it exists
Global synchronisation does not guarantee local stability.
Co-Movement Is Not Exposure
Rolling beta: FTSE sensitivity to MSCI (30-day)
Rolling R² (correlation²)
With event bands
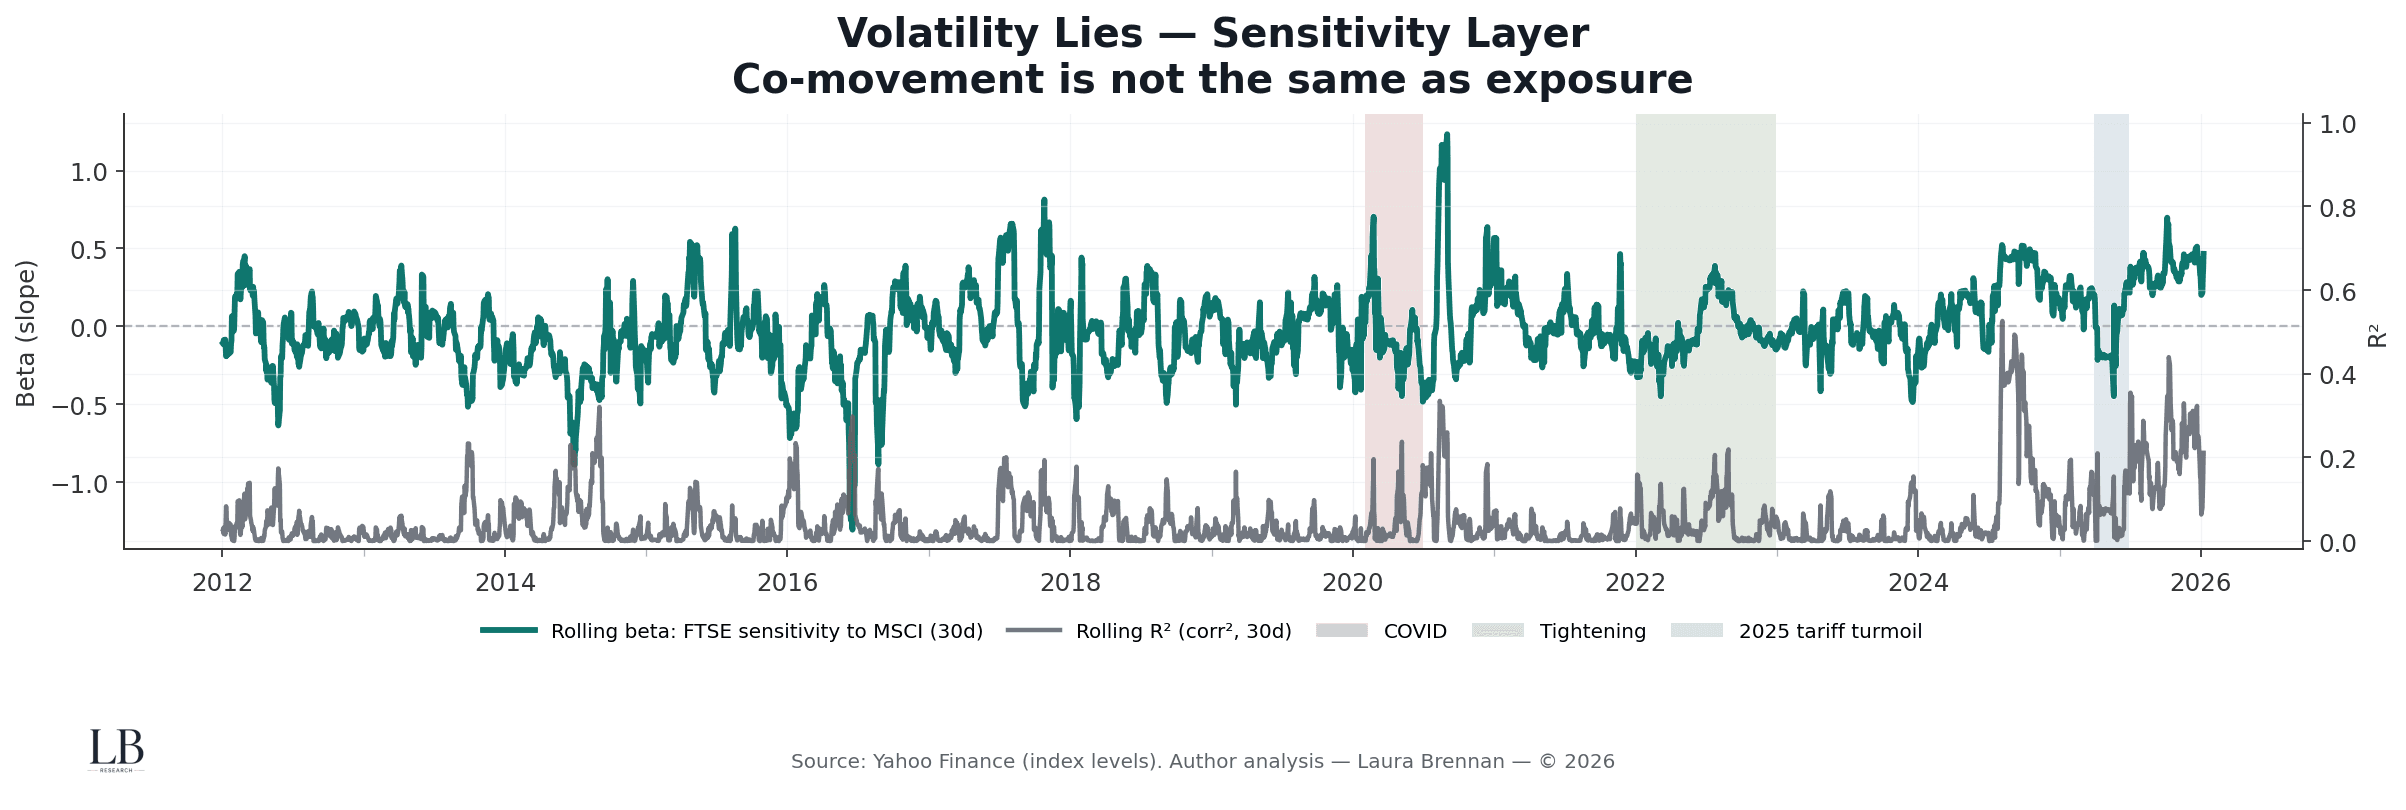
This chart separates co-movement from exposure.
Correlation shows alignment.
Beta shows sensitivity.
They are not the same.
• High R² can coexist with low or unstable beta
• Exposure shifts even when correlations appear stable
• Sensitivity spikes cluster around stress transitions
• Risk is embedded in slope, not just synchronisation
Markets can move together without sharing the same risk.
Transmission Is Not Always Simultaneous
Synchronous coupling: corr(MSCI, FTSE) (30-day)
Lead–lag coupling: corr(MSCI(t−5), FTSE(t)) (30-day)
Lead advantage: lead–lag minus synchronous coupling
With event bands
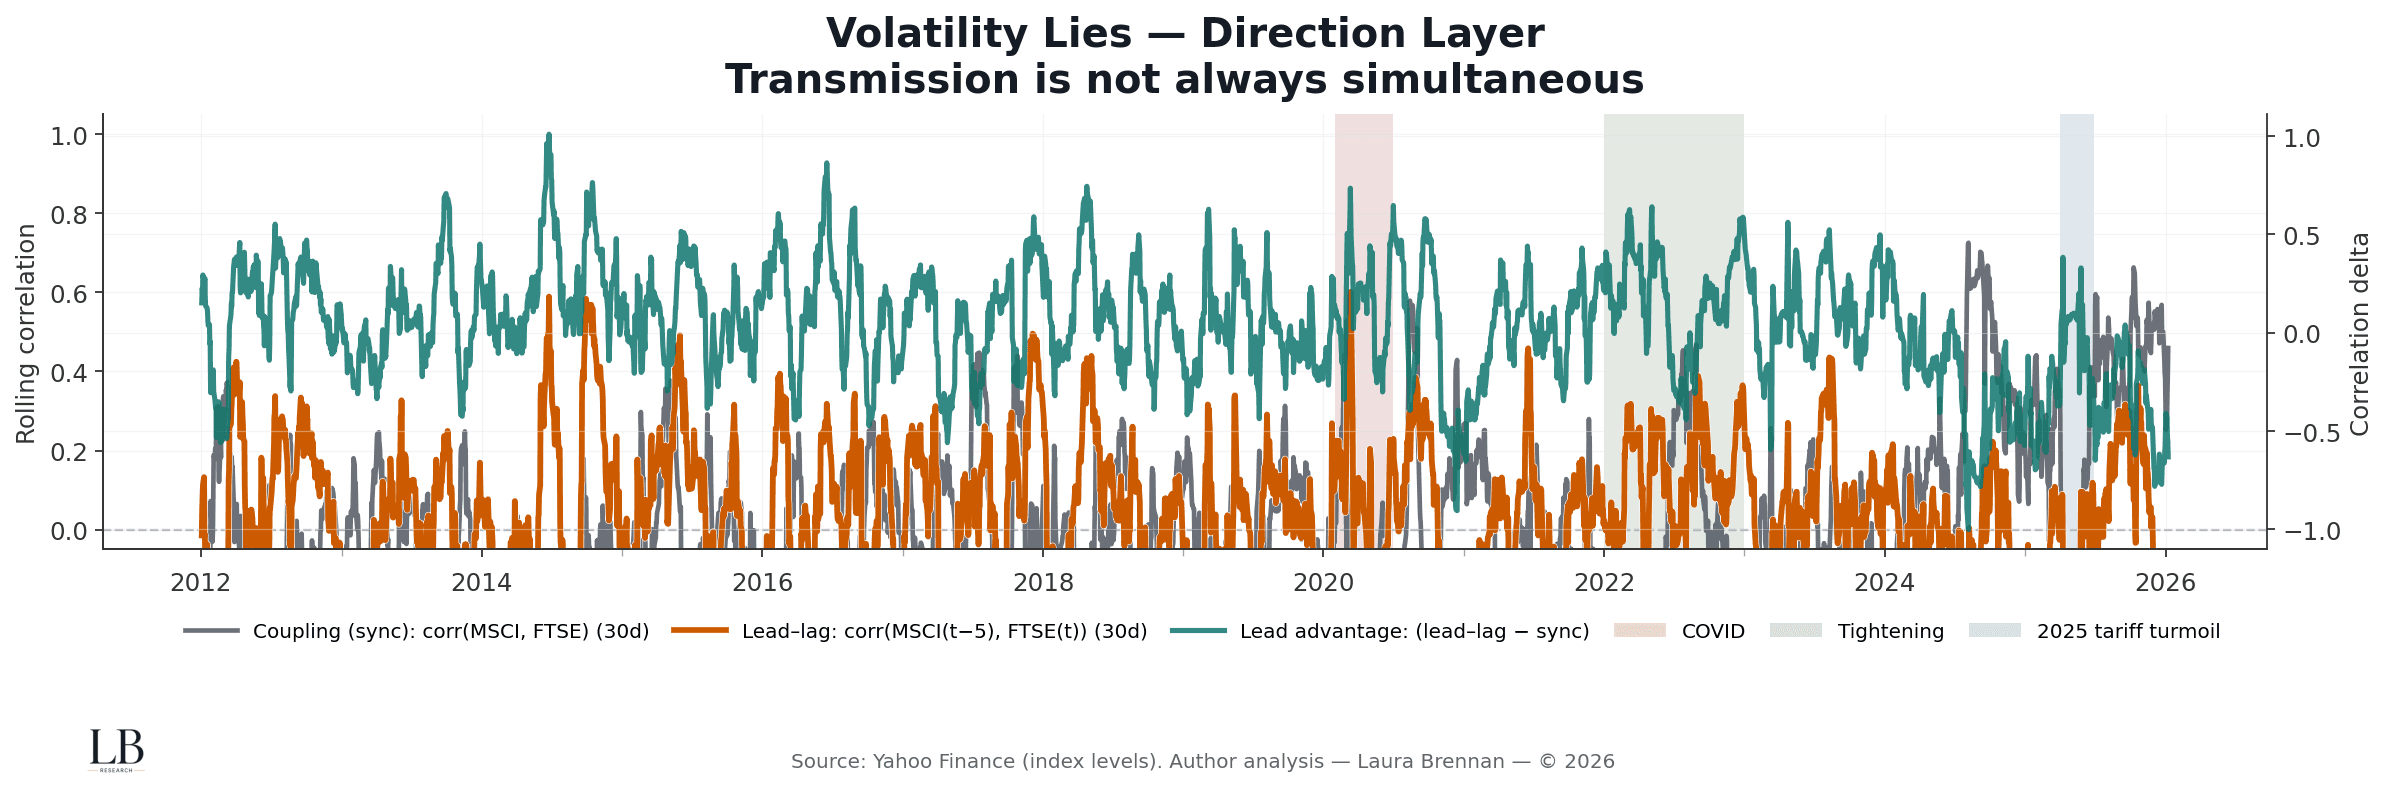
This chart shows that stress transmission is often directional, not instantaneous.
Risk moves through the system before it is fully reflected across assets.
• Lead–lag relationships strengthen ahead of synchronous coupling
• Directional transmission precedes visible co-movement
• Timing differences widen during regime transitions
• Synchronisation often arrives after stress is already embedded
Markets rarely reprice risk all at once.
The Structural Read
Across all four views, the conclusion is the same:
• volatility can remain muted while fragility rises
• coupling tightens before volatility confirms stress
• exposure shifts independently of correlation
• transmission is sequential, not simultaneous
Calm markets do not imply stable structure.
They often imply deferred repricing.
Methodology
• Daily data
• Global equity proxy: MSCI World
• Local equity proxy: FTSE 100
• Volatility: 30-day realised, annualised
• Coupling: rolling correlations (FAST and SLOW filters)
• Sensitivity: rolling beta and R²
• Direction: synchronous vs lead–lag correlations
• Smoothing: short rolling averages for visual clarity
• Event windows: major stress regimes for alignment
• Sources: Yahoo Finance (index levels)
• Analysis: Laura Brennan


