Market Structure
What Spikes vs What Sticks
Feb 13, 2026

What Spikes vs What Sticks
Why short shocks fade, but structural stress lingers
Markets react quickly to shocks.
But they recover slowly from stress.
This Insight separates fast stress from persistent stress, showing how volatility spikes are processed rapidly, while deeper structural strain remains embedded in the system long after prices appear calm.
Across cycles, the message is consistent:
volatility fades before stress clears.
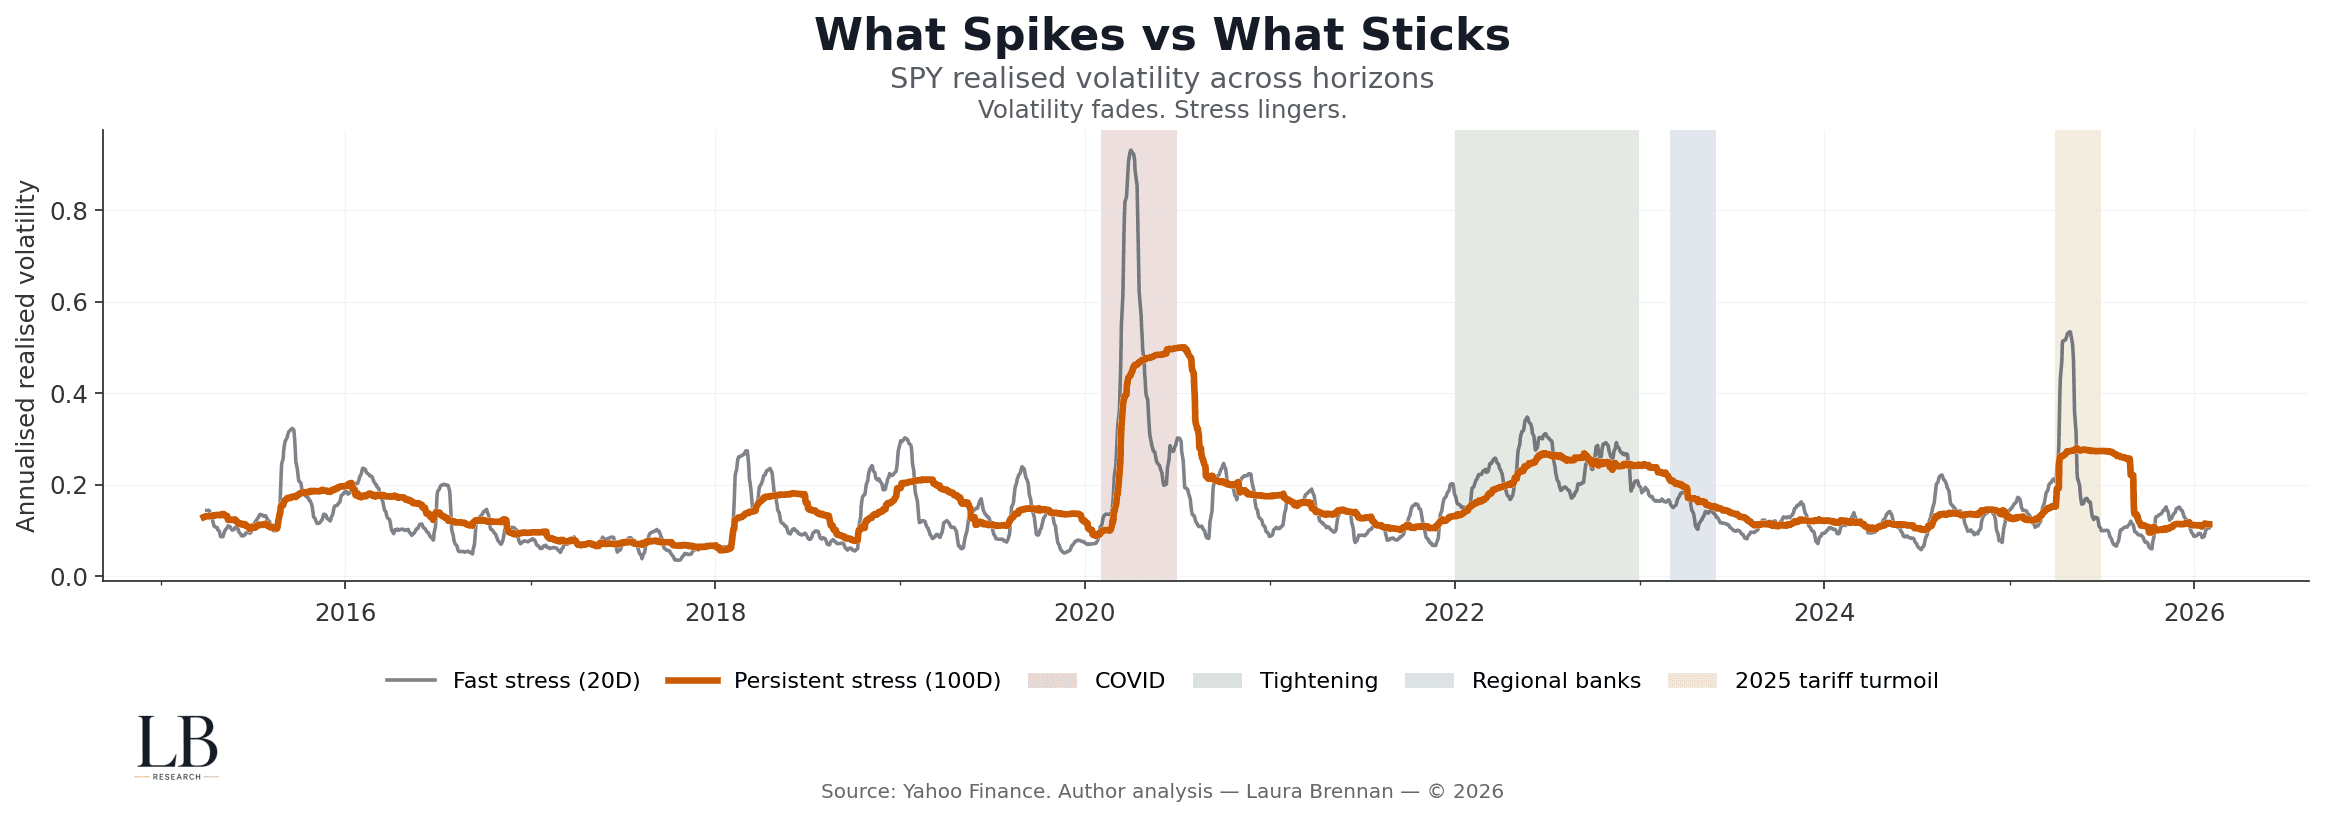
(Fast vs persistent realised volatility)
This chart decomposes SPY realised volatility across two horizons:
• Fast stress (20D realised volatility) short-lived shock response
• Persistent stress (100D realised volatility) longer-term structural pressure
Event windows highlight major stress regimes.
What stands out:
• Fast stress spikes sharply during shocks, then mean-reverts quickly
• Persistent stress rises more slowly, but remains elevated well after the shock passes
• The gap between the two widens during structural episodes, not just crises
• Calm markets often coexist with elevated persistent stress
Volatility measures reaction.
Persistence measures damage.
When Stress Becomes Structural
Persistent dominance over fast shock processing
Shocks are not the problem.
What matters is whether stress clears.
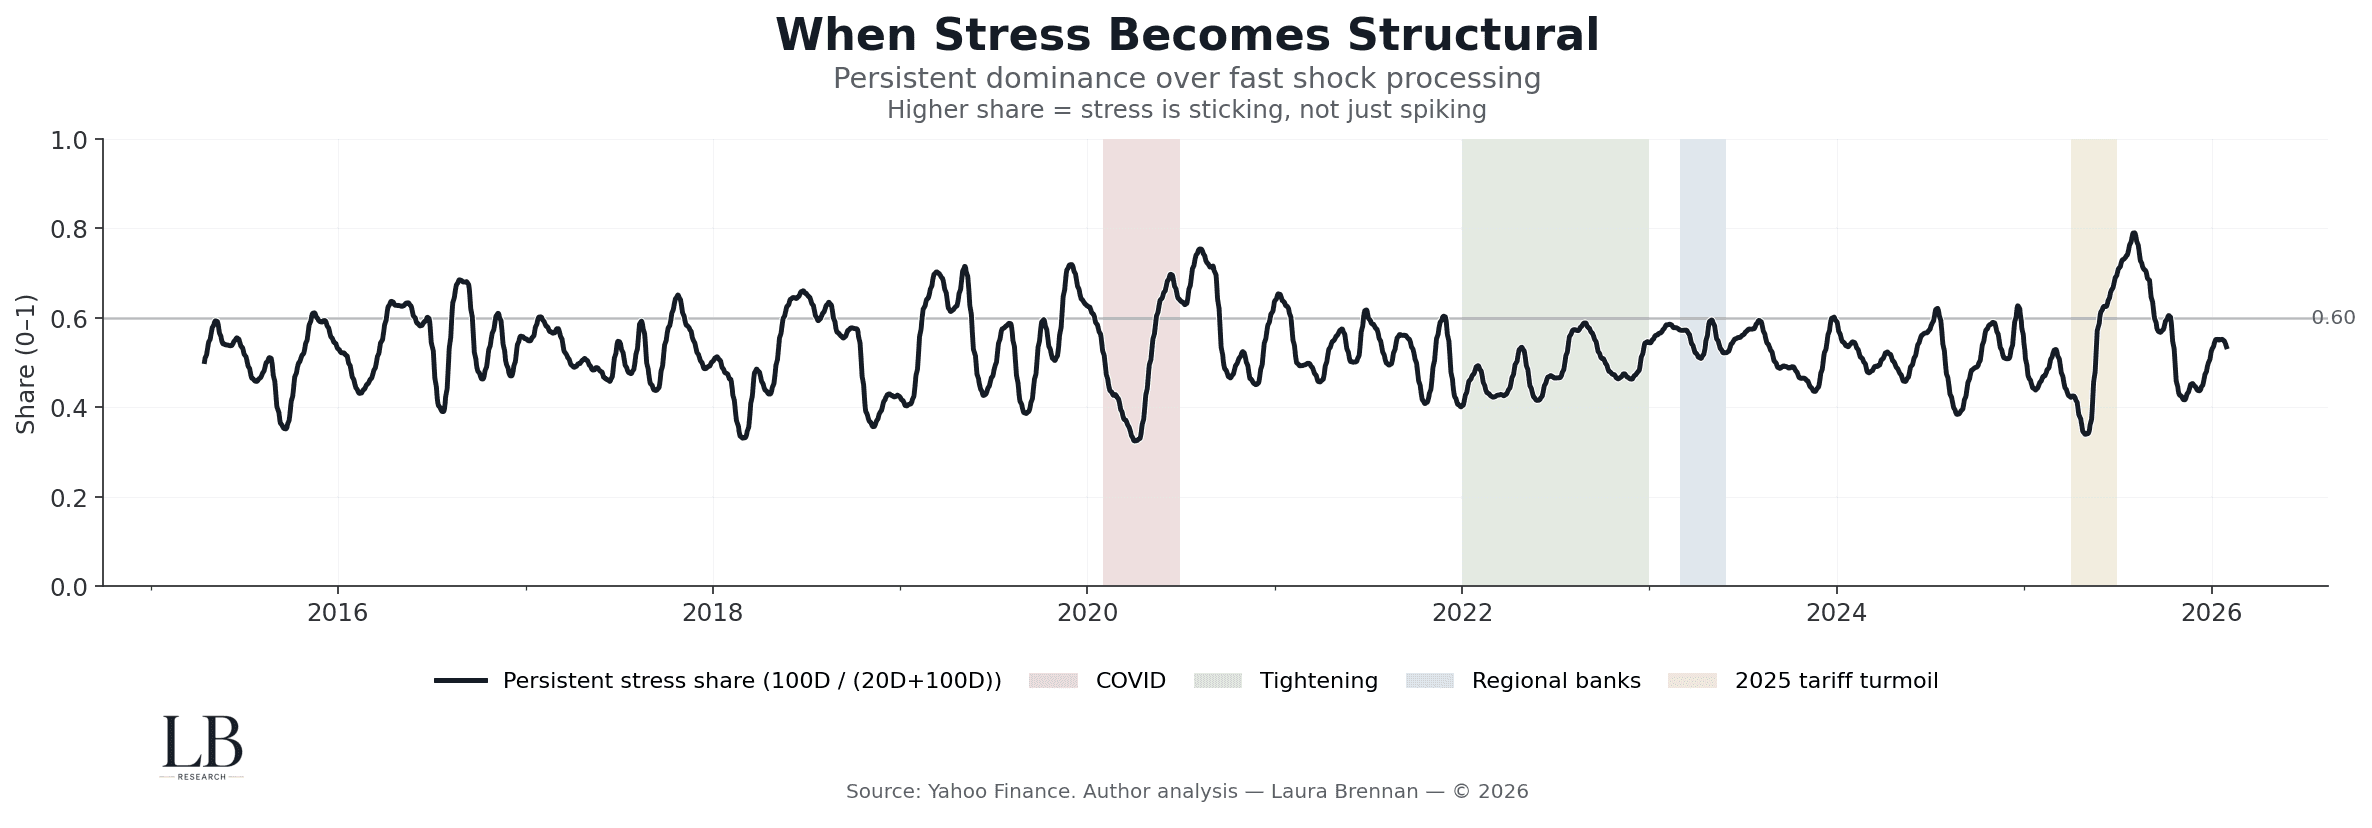
(Persistent stress share)
This chart tracks the share of total stress coming from the persistent component:
Persistent share=100D / 20D + 100D
Higher values indicate stress that is sticking, not just spiking.
Key observations:
• Persistent stress dominates more than half of total stress most of the time
• Structural regimes are marked by sustained elevation in this share
• COVID, tightening, and recent episodes show persistence, not just shock
• The system can look stable while remaining structurally strained
Stress does not need to be extreme to be structural.
It just needs to linger.
Quiet Is Not Stable
Low volatility can coexist with persistent stress
Calm price action is often mistaken for stability.
It is not the same thing.
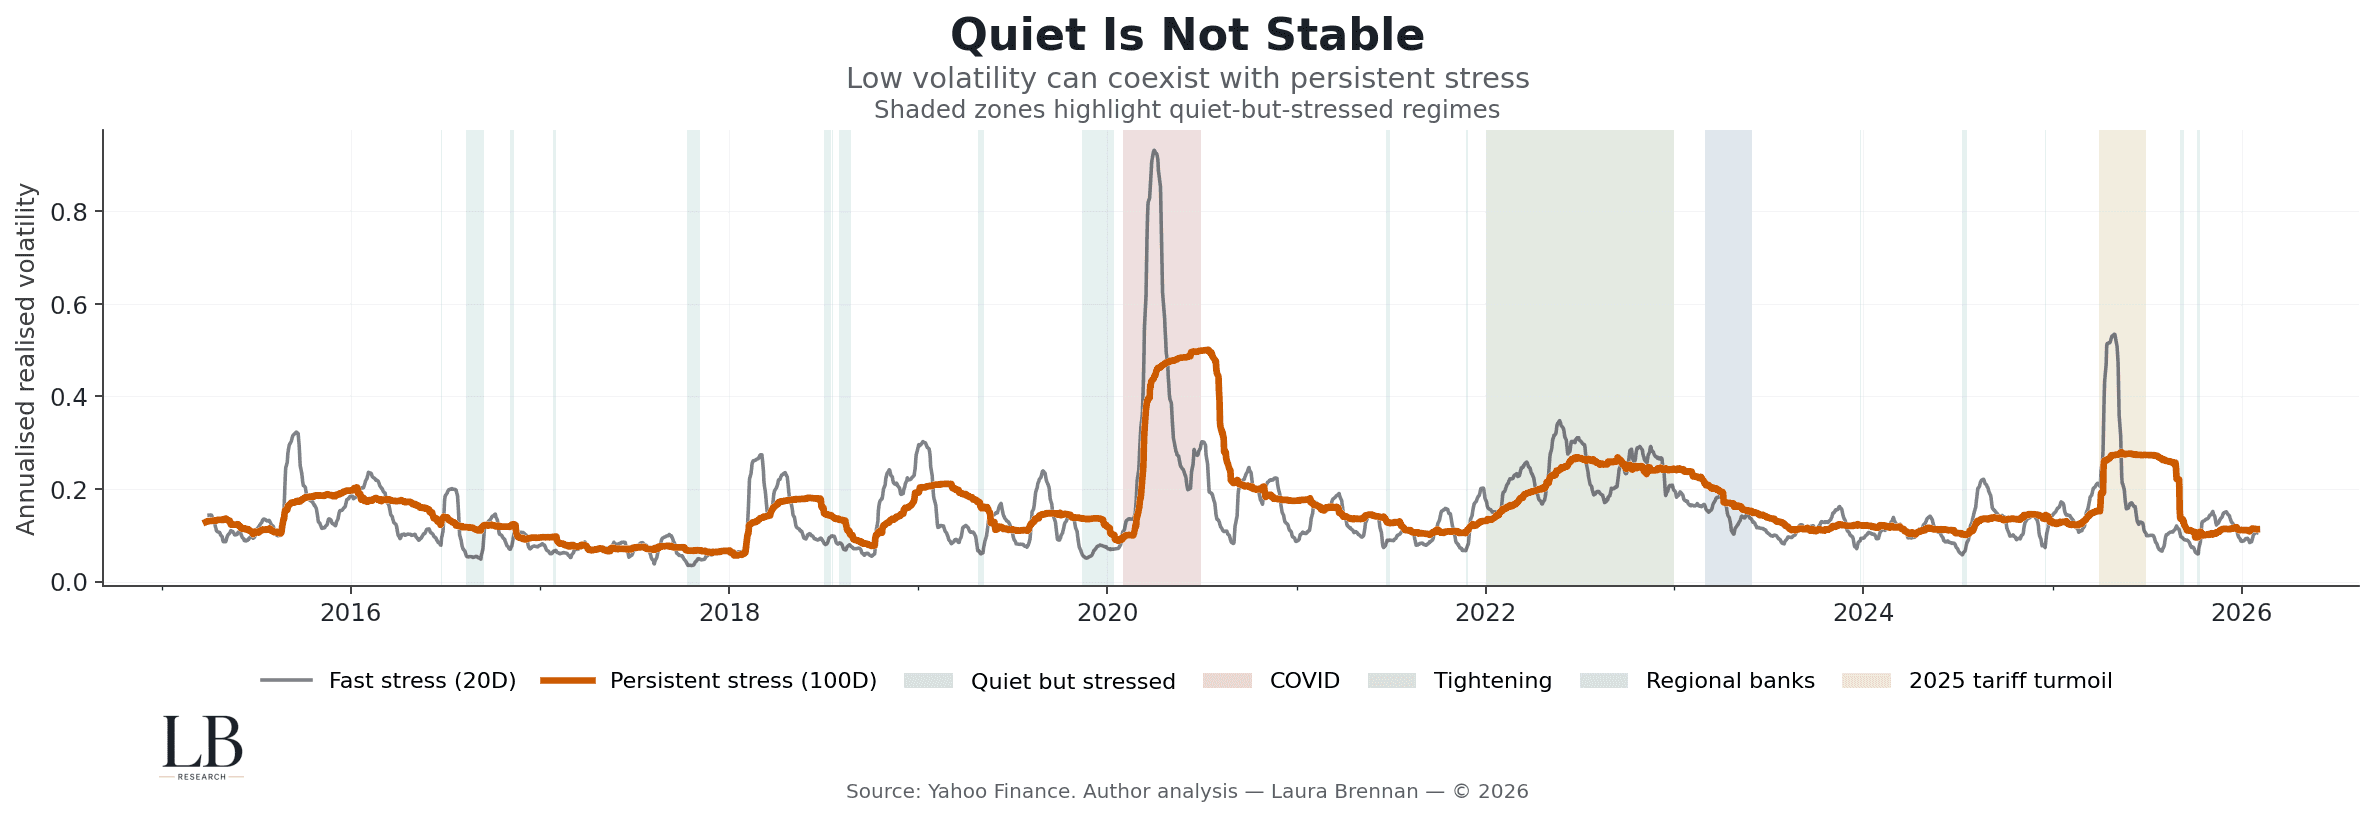
(Quiet-but-stressed regimes)
This chart overlays fast and persistent stress while highlighting periods where:
• Fast stress is subdued
• Persistent stress remains elevated
These are quiet-but-stressed regimes.
What this reveals:
• Some of the most fragile periods occur without volatility spikes
• Persistent stress remains high even as fast measures normalise
• Risk builds quietly before it becomes visible in price action
• Volatility is a lagging signal of structural strain
Calm markets are not necessarily healthy.
They may simply be absorbing stress poorly.
Decay vs Persistence
How fast stress fades versus how long it sticks
Shock processing speed matters.
But so does recovery.
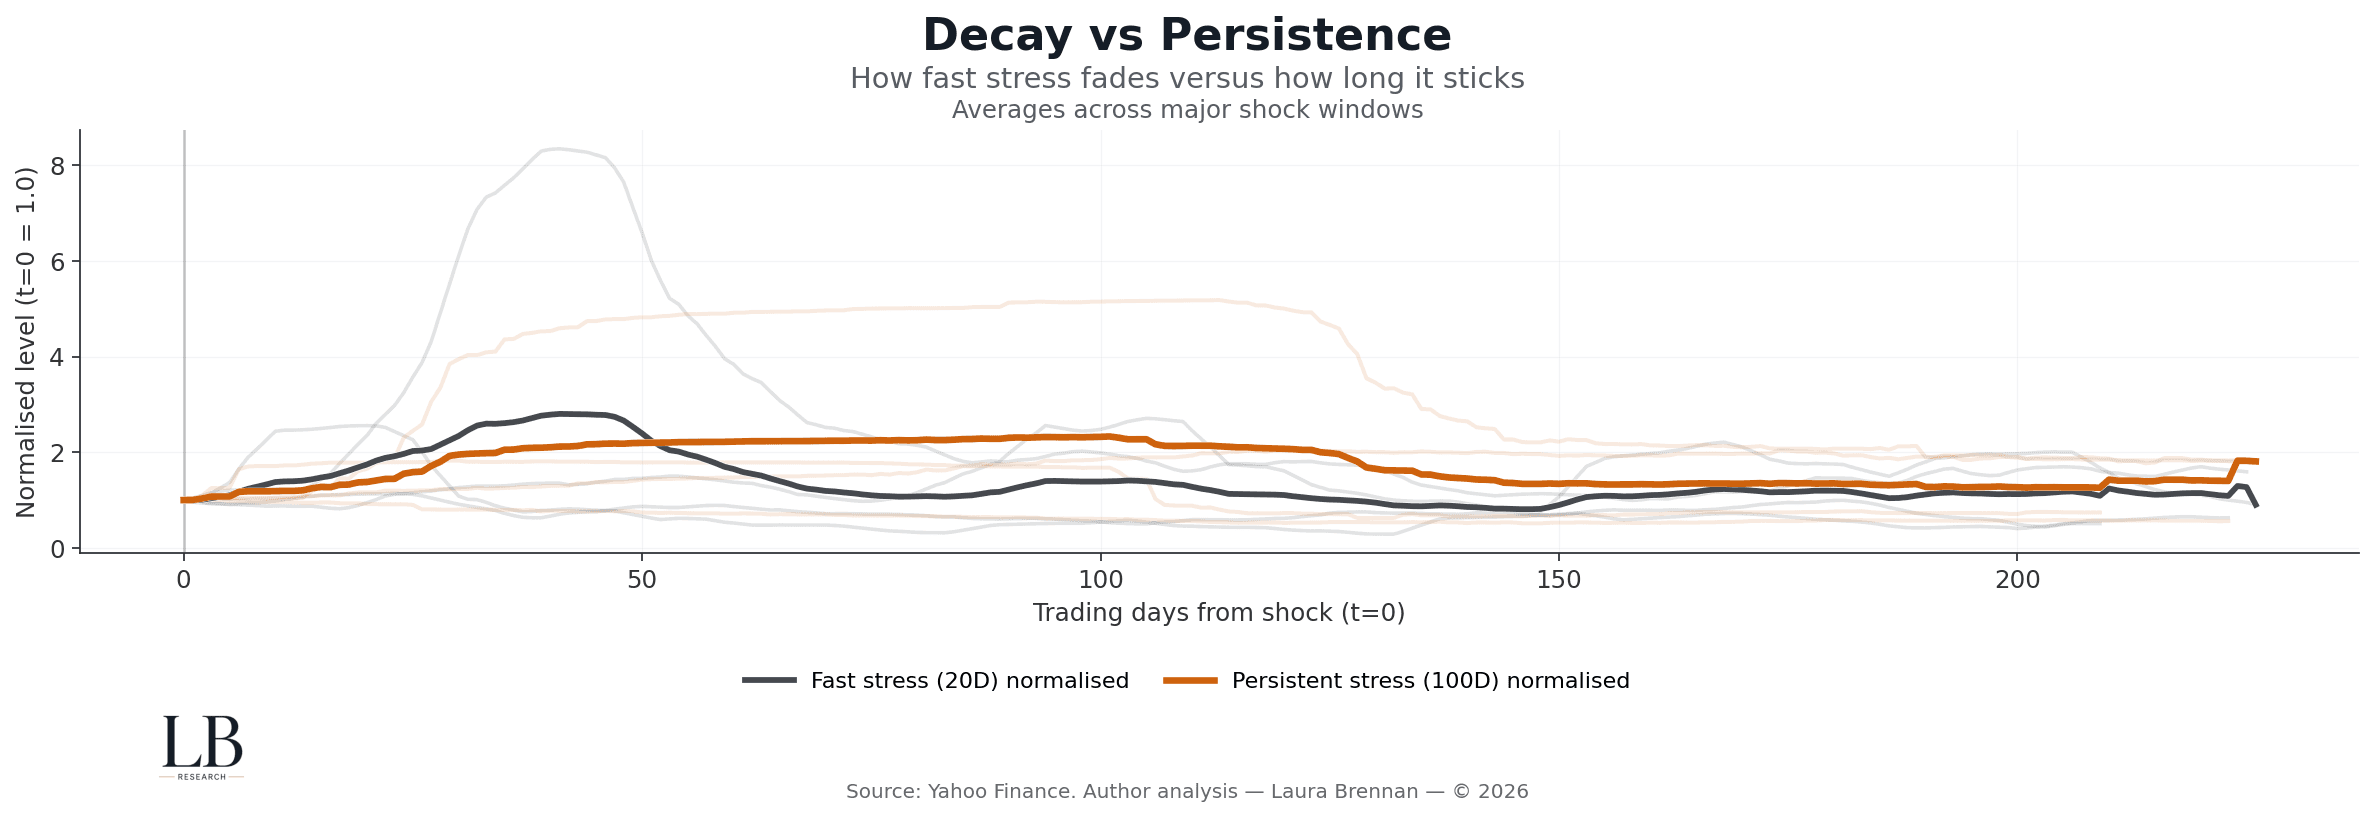
(Average stress response around major shocks)
This chart aligns major shock windows and normalises stress at the event date.
It compares how fast and persistent stress evolve after the shock.
What emerges:
• Fast stress peaks early, then decays rapidly
• Persistent stress rises more slowly, plateaus, and remains elevated
• The gap between the two persists long after the shock
• Structural damage outlives volatility by months, sometimes years
Markets are good at reacting.
They are slower at healing.
The Structural Read
Across all four views, the conclusion is the same:
• stress has horizons
• shocks are transient
• persistence is structural
• volatility alone understates fragility
Markets do not fail when volatility spikes.
They fail when persistent stress is ignored.
Methodology
• Asset: SPY
• Prices: daily close
• Returns: log returns
• Fast stress: 20-day realised volatility (annualised)
• Persistent stress: 100-day realised volatility (annualised)
• Smoothing: 5-day mean applied to fast stress for visual clarity
• Persistent share: 100D / (20D + 100D)
• Quiet-but-stressed regimes: low fast stress with elevated persistent stress
• Event windows: major stress regimes for alignment
• Source: Yahoo Finance
• Analysis: Laura Brennan


