
When Correlation Creeps
When Cross-Asset Linkages Tighten Without Headlines
Equity volatility usually gets the attention.
Correlation rarely does.
Cross-asset correlations evolve quietly, often without volatility confirmation.
When equity–FX correlation tightens while markets appear calm, the system is rarely as stable as it looks.
This Insight decomposes the equities-US dollar correlation structure into four layers:
• The baseline linkage – when equities and FX quietly re-align
• Persistence – how long correlations hold once they move
• Window sensitivity – speed versus memory
• Stress rewiring – how correlation behaves under pressure
Together, they form a structural read of market coherence and fragility that sits beneath returns, sentiment, and headline volatility.
Equities vs US Dollar
60-Day Rolling Correlation
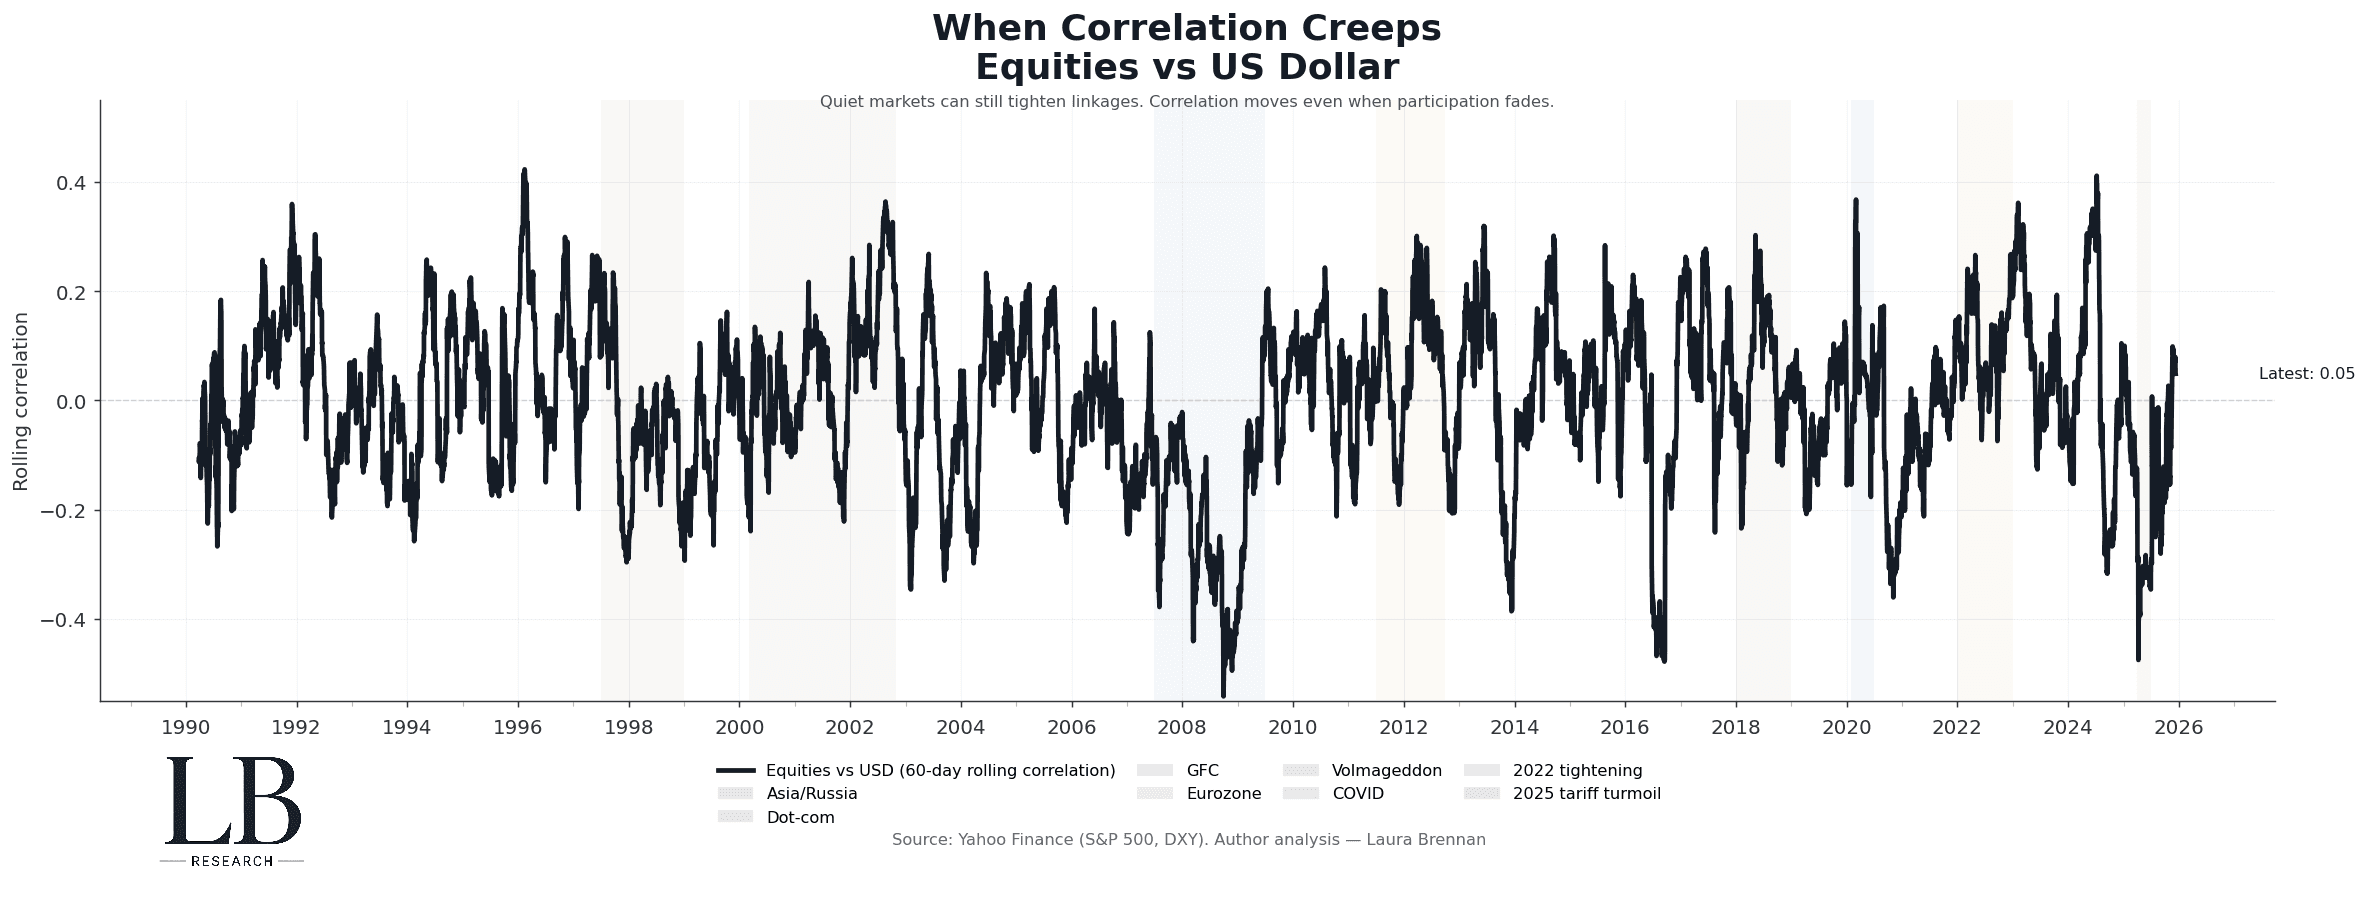
This chart tracks the rolling correlation between the S&P 500 and the US dollar across multiple decades.
Most of the time, the relationship oscillates around zero.
That reflects a market where risk is distributed and macro forces compete.
When correlation tightens and stays tight, the signal is different:
• risk factors aligning beneath the surface
• macro forces becoming dominant
• diversification quietly eroding
• structure shifting without volatility
Across the long sweep:
• late-1990s: correlation tightens during global capital stress
• early-2000s: dot-com unwind reshapes equity–FX linkages
• 2007–09: correlation rewires sharply through the GFC
• 2020: synchronized stress during COVID
• 2022: tightening cycles re-anchor FX–equity dynamics
• recent periods: correlation moves persist even as volatility fades
Correlation does not need drama to matter.
It only needs to stop behaving randomly.
Where Structure Persists
Correlation Speed vs Correlation Memory
Window Sensitivity (30 / 60 / 120 Days)
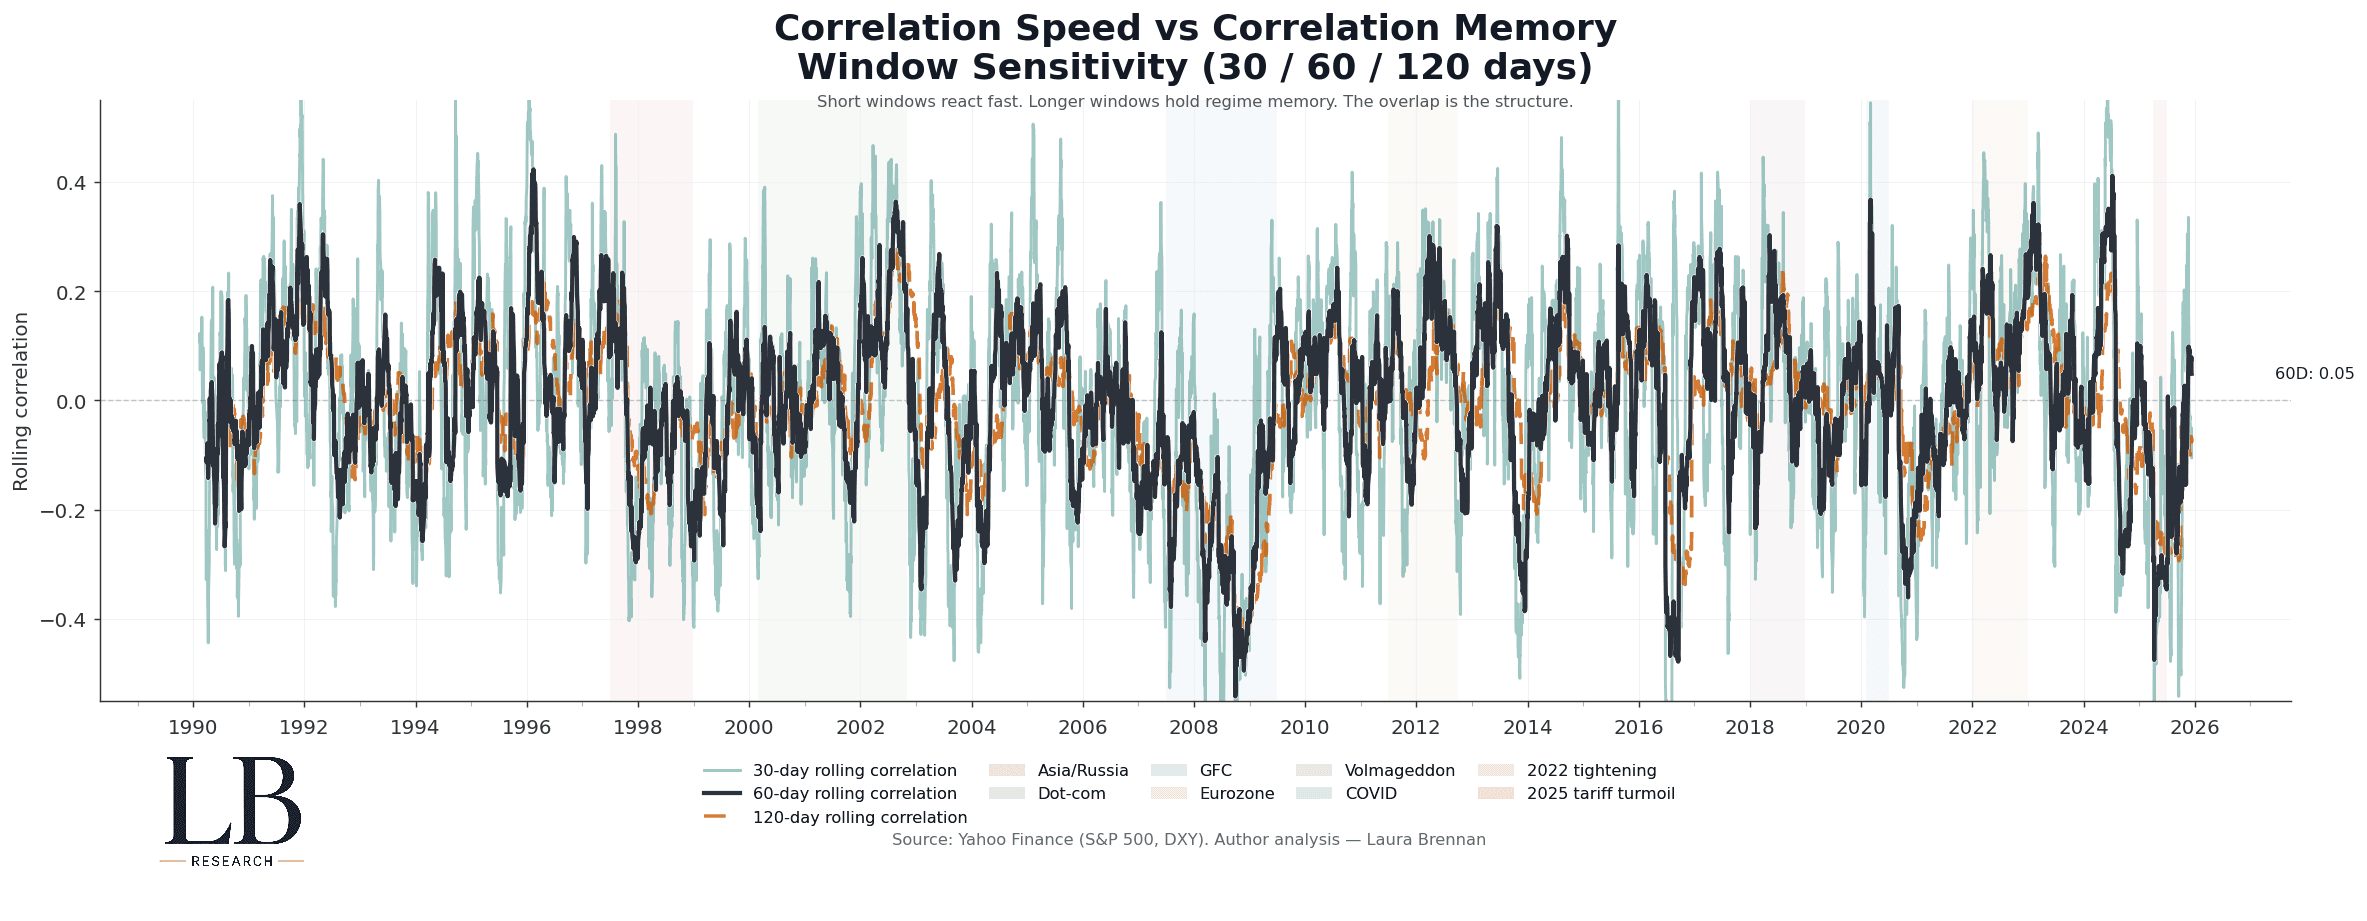
This chart compares equity–FX correlation across short, medium, and long rolling windows.
Each window reveals a different layer of market behaviour:
• short windows capture reaction
• longer windows retain regime memory
• overlap reveals structural persistence
What stands out is not the noise, but the consistency of overlap.
When correlation aligns across windows, the market is not reacting.
It is settling into a structure.
That persistence matters more than any single print.
How Correlation Rewires Under Stress
Equities vs US Dollar
Stress-Period Zooms (60-Day Correlation)
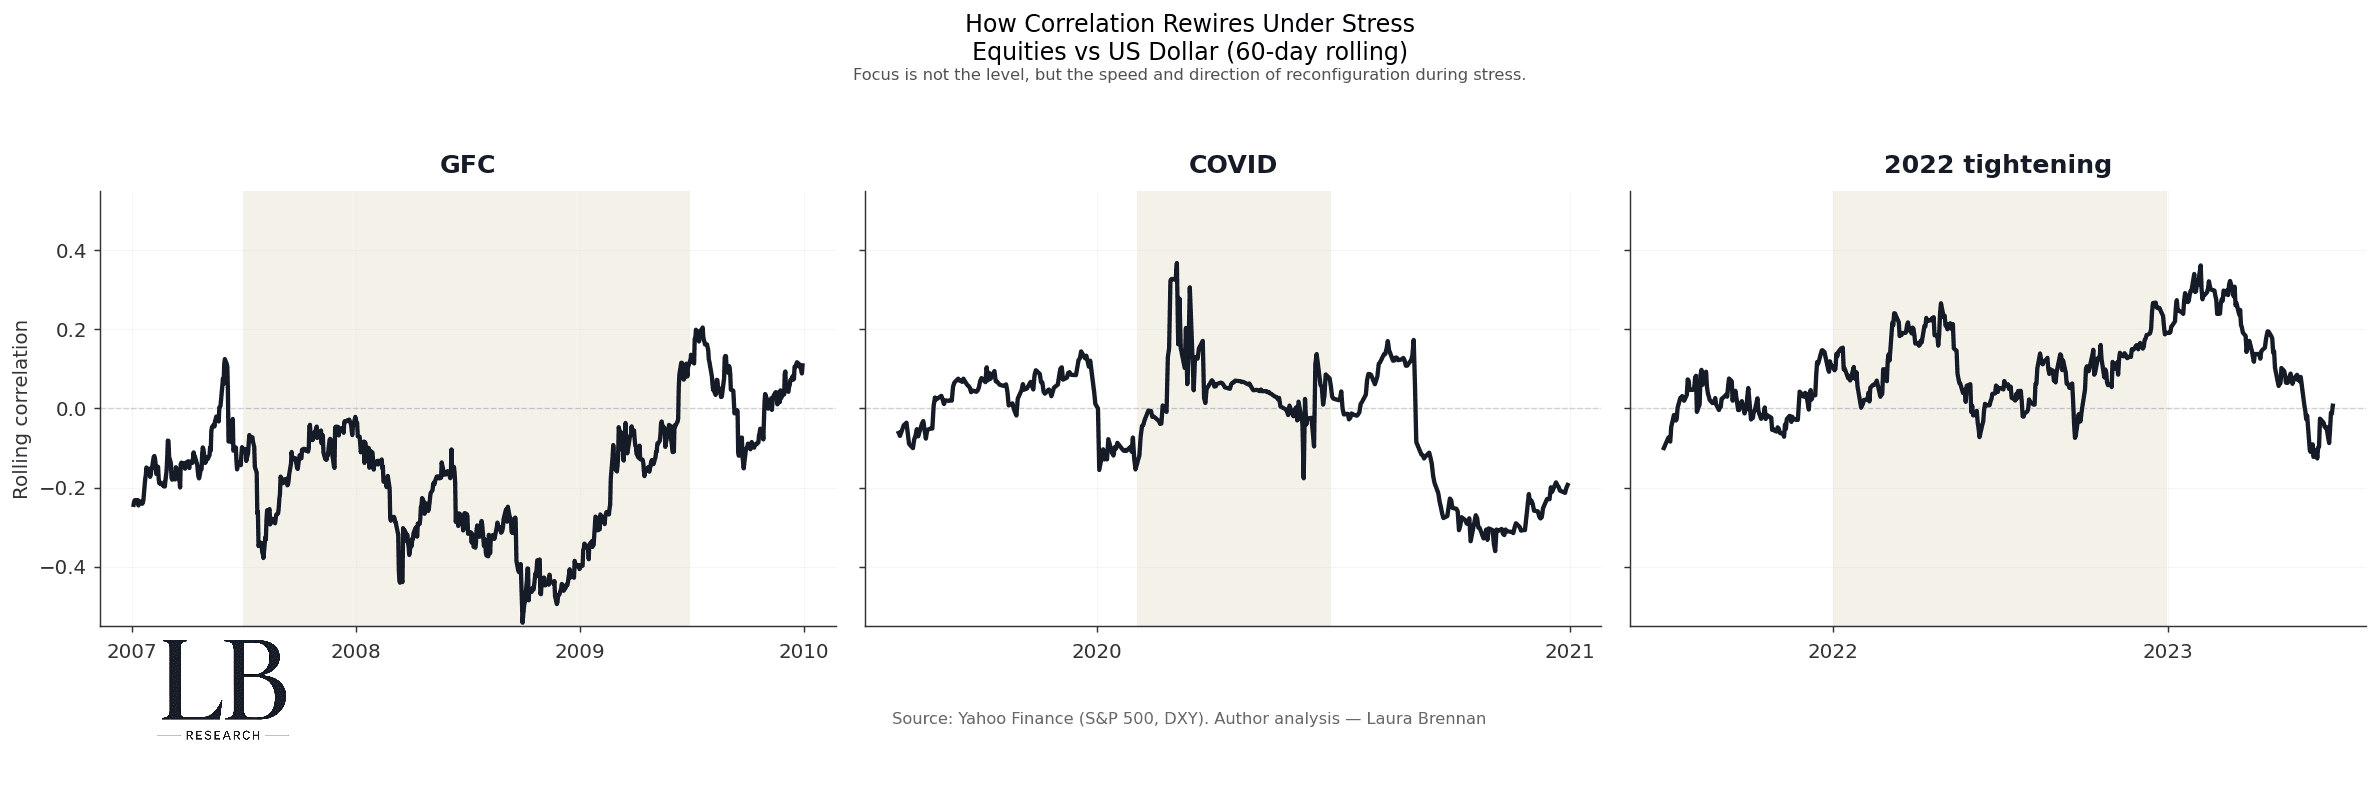
This chart isolates major stress episodes to show how correlation behaves during regime breaks.
The pattern is not uniform:
• stress does not always raise correlation
• direction matters as much as magnitude
• correlation often shifts before narratives catch up
Across episodes:
• crises compress relationships rapidly
• policy shocks distort linkages asymmetrically
• post-stress regimes retain altered structure
Correlation does not spike.
It reconfigures.
The Structural Read Today
Across all four layers:
Baseline linkage:
Equity–FX correlation continues to evolve even during quiet periods.
Persistence:
Once correlation tightens, it tends to linger longer than expected.
Window sensitivity:
Short-term noise fades, but medium-term structure remains intact.
Stress behaviour:
Recent regimes show adjustment without full systemic breakdown.
This is not equilibrium.
It is a market repeatedly testing how tightly risk should be shared.
Calendar calm does not imply structural calm.
Correlation is already telling that story.
Methodology
• Daily S&P 500 and US Dollar Index data (Yahoo Finance)
• Log returns
• Rolling correlations (30 / 60 / 120 trading days)
• Stress windows applied ex-post (GFC, COVID, 2022 tightening)
• Analysis by Laura Brennan


