Market Structure
When Correlation Rises, Fragility Hides
Jan 29, 2026

When Correlation Rises, Fragility Hides
Why Markets Can Tighten Without Looking Stressed
Markets often look calm when volatility is low.
But volatility is not structure.
It is surface expression.
This Insight examines how market fragility can build quietly beneath the surface, showing why rising correlation, thinning breadth, and collapsing differentiation often precede visible stress.
Across cycles, the message is consistent:
structure tightens before volatility reacts.
Correlation Without Volatility
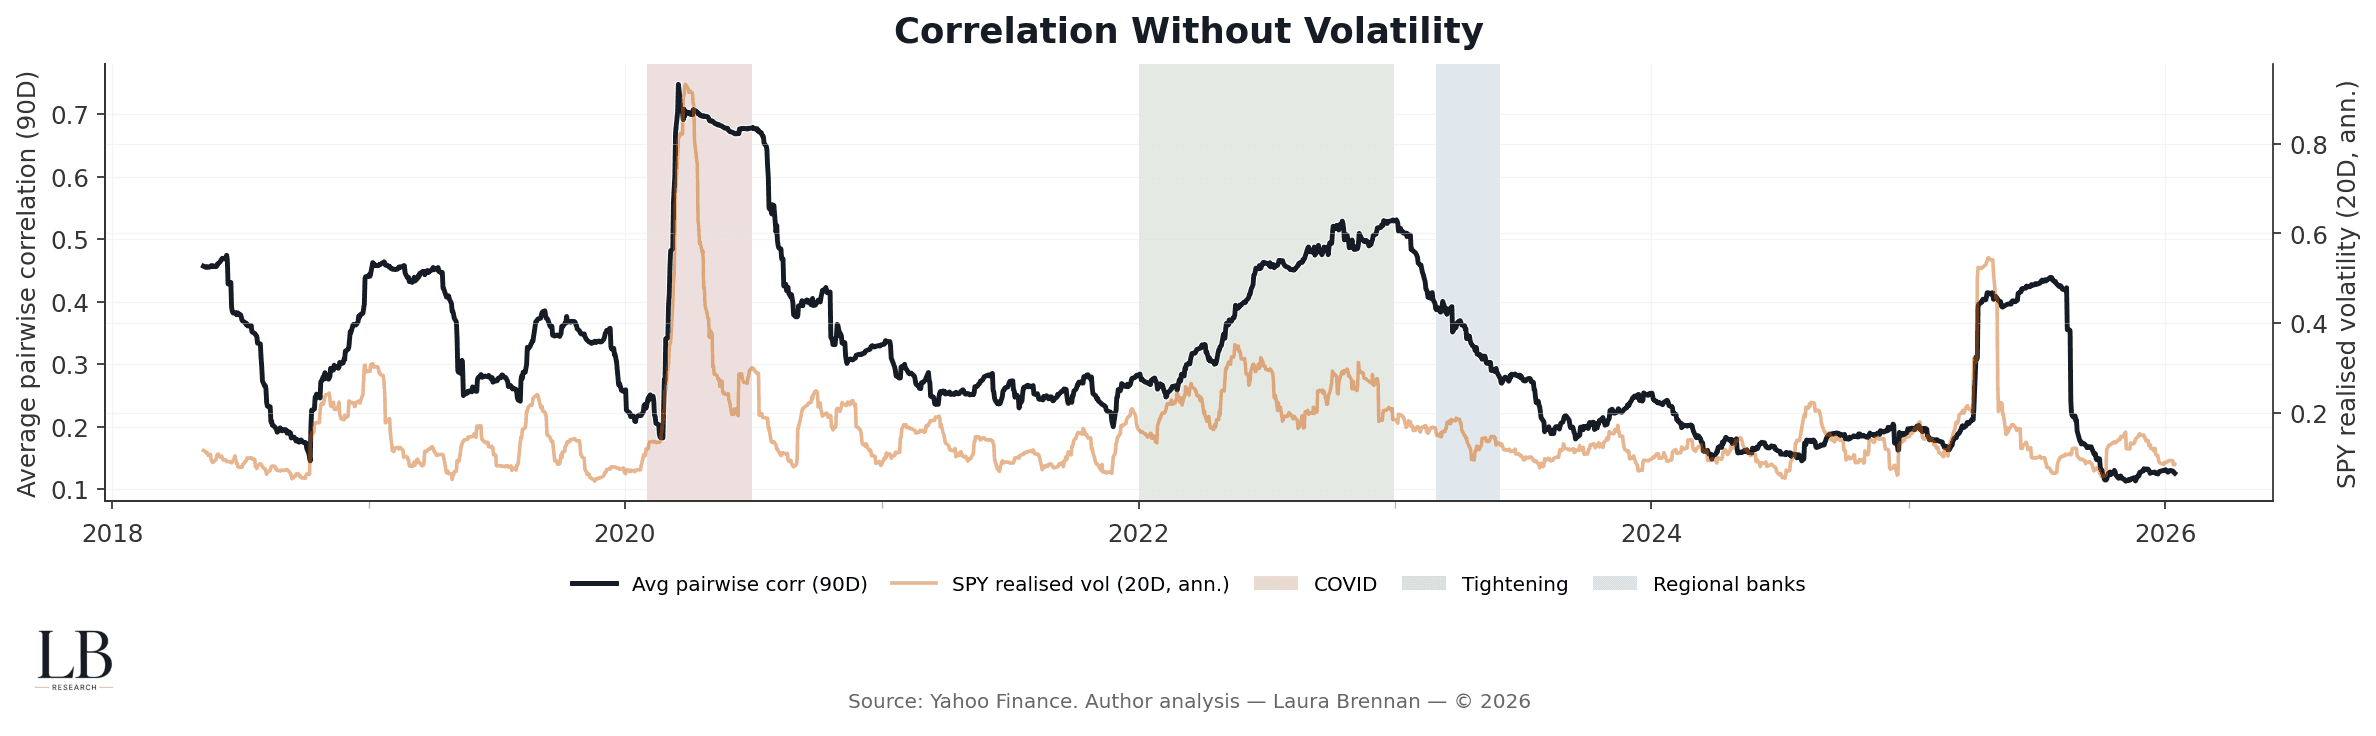
Average pairwise correlation (90-day)
SPY realised volatility (20-day, annualised)
With event bands
This chart contrasts surface calm with underlying synchronisation.
What matters is not whether volatility is low.
It is whether assets are increasingly moving as one.
• Correlation can rise even when volatility remains muted
• Tight coupling often persists after volatility spikes fade
• Calm volatility can mask growing systemic linkage
• Structural stress builds before it becomes visible in prices
Volatility measures noise.
Correlation measures architecture.
Breadth Thins as Correlation Rises
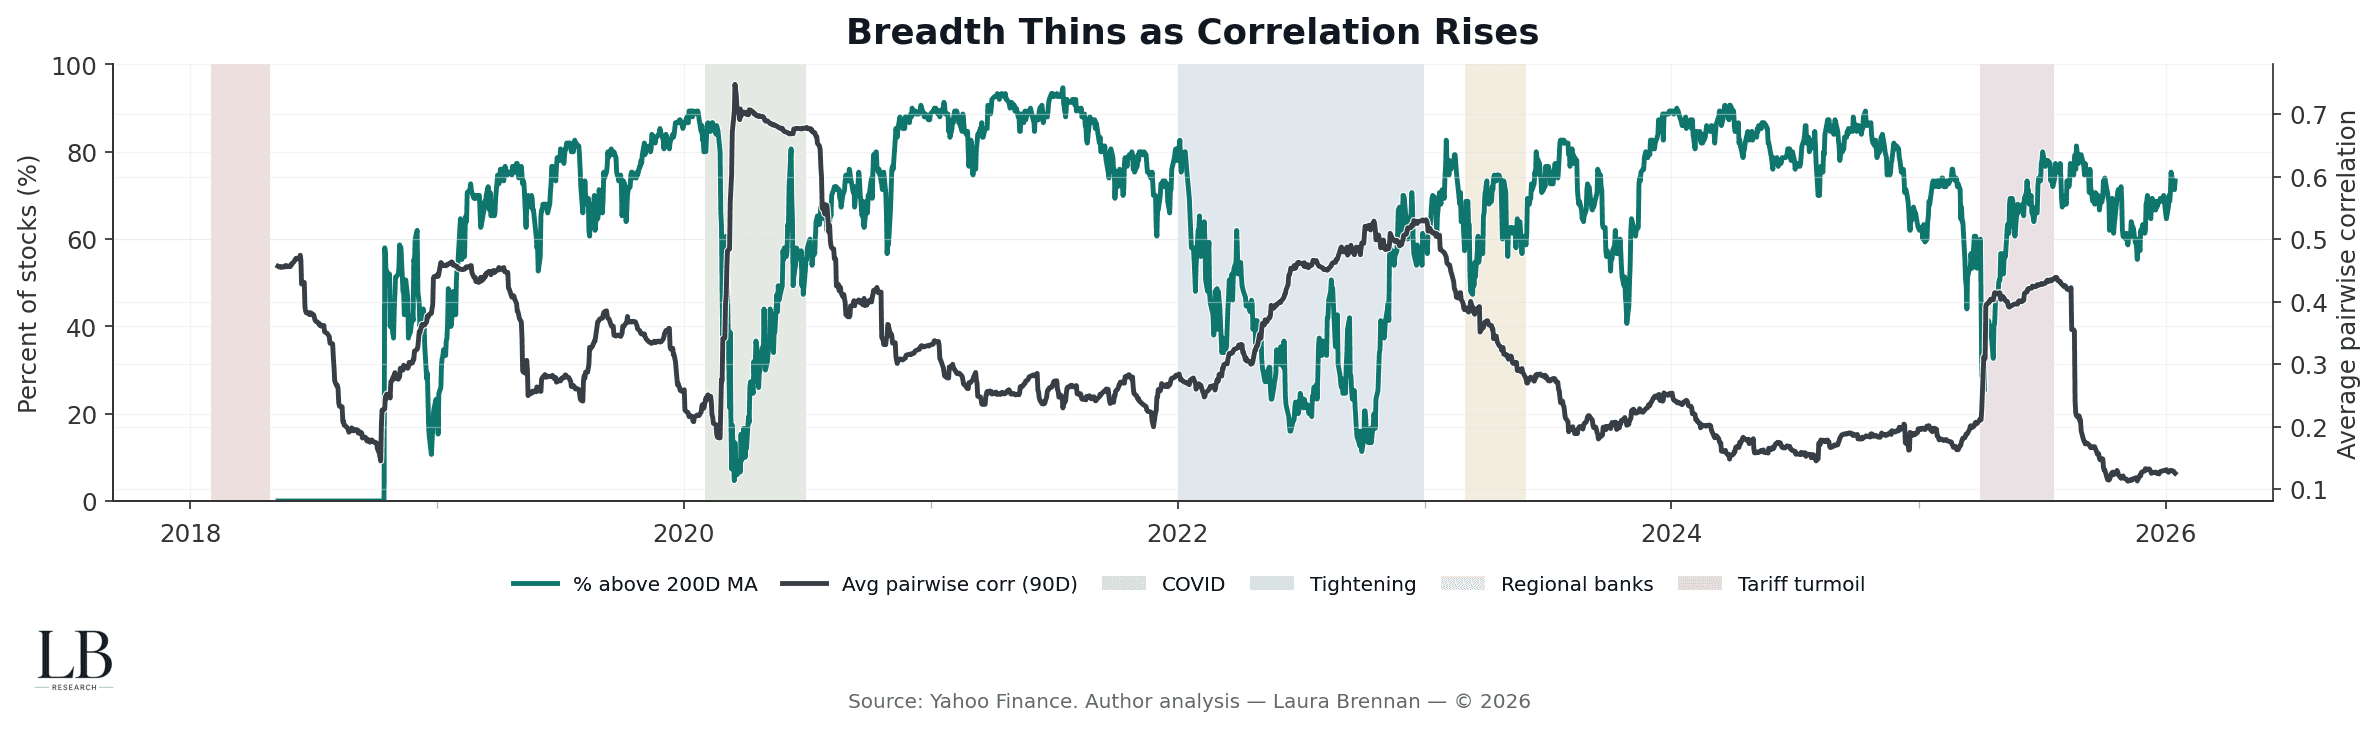
% of stocks above 200-day moving average
Average pairwise correlation (90-day)
With event bands
This chart shows what happens inside the market as correlation tightens.
Rising correlation is not usually broad participation.
It is narrowing leadership.
• Fewer stocks carry the index as correlation rises
• Breadth weakens even during calm price regimes
• Index stability can coexist with internal fragility
• Concentration increases vulnerability to shocks
Markets often look strongest just as participation disappears.
Structure Tightens as Differentiation Fades
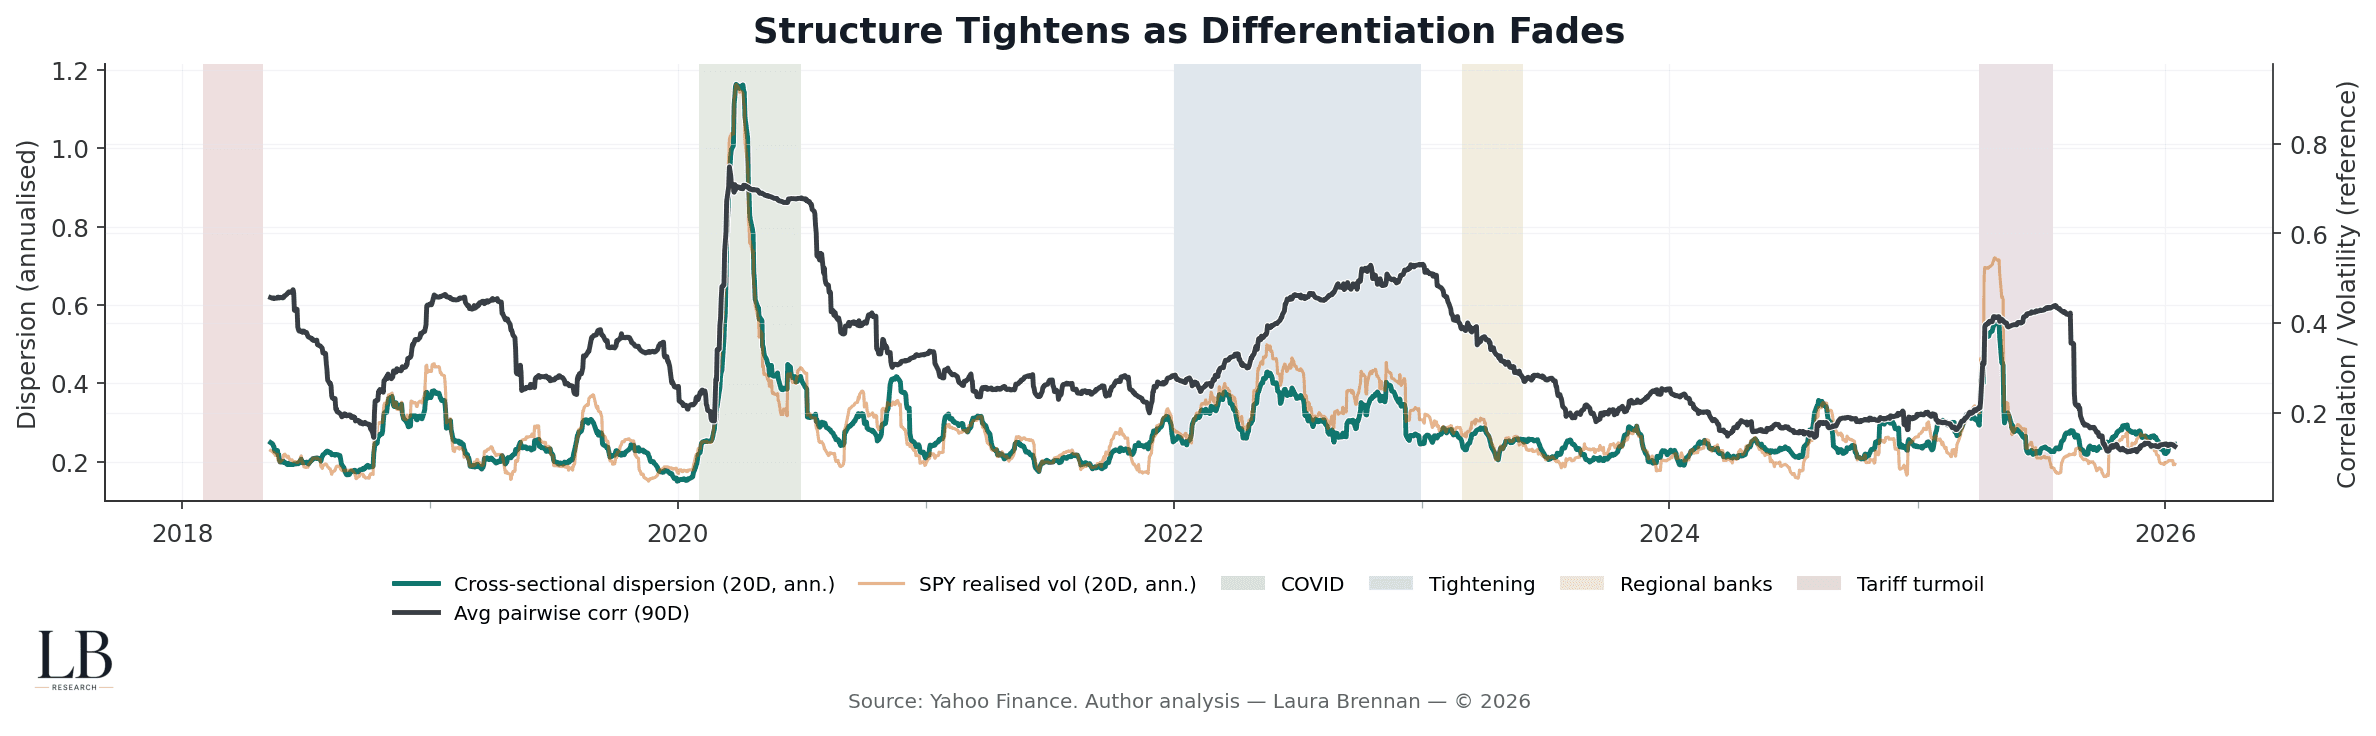
Cross-sectional dispersion (20-day, annualised)
Average pairwise correlation (90-day)
SPY realised volatility (reference)
With event bands
This chart explains why correlation rises.
When dispersion collapses, assets stop behaving independently.
• Falling dispersion reflects loss of differentiation
• Correlation rises because disagreement disappears
• Volatility can remain low while structure tightens
• Fragility emerges from uniformity, not panic
Systemic risk grows when everything starts to move the same way.
Time-series indicators show when structure tightens.
This heat map shows how it is organised.
What the Structure Looks Like Right Now
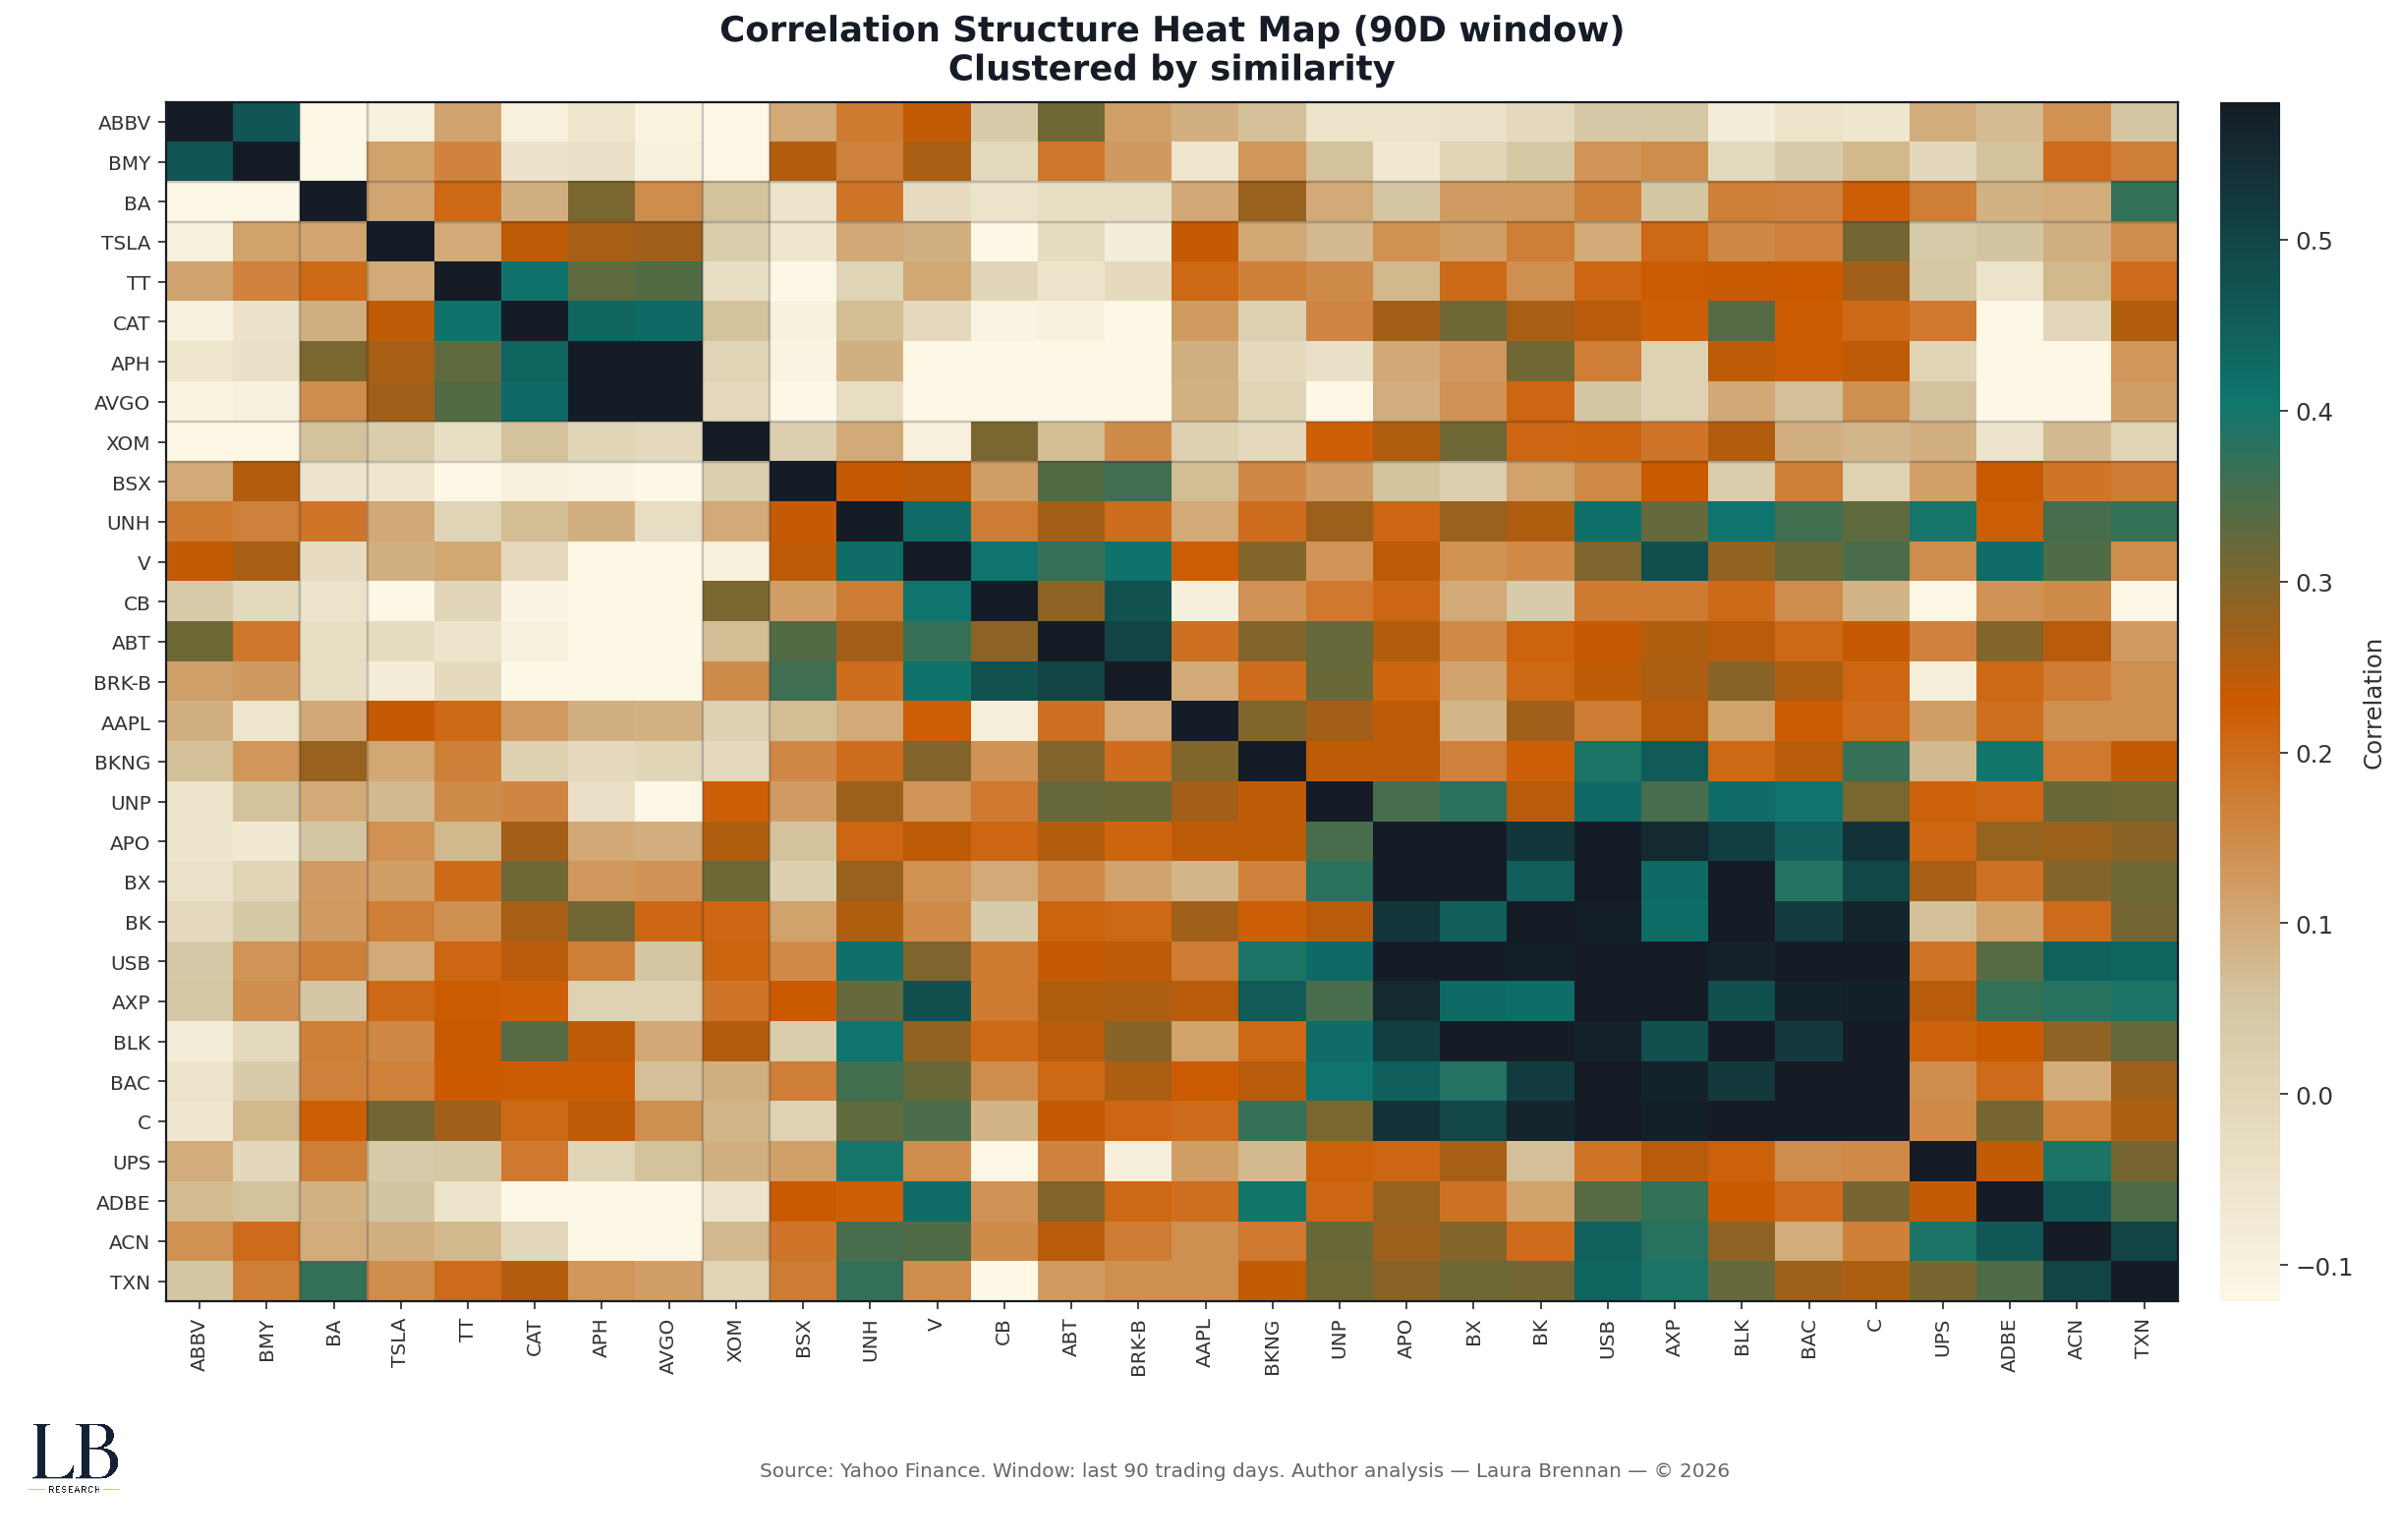
Correlation structure heat map (90-day window)
Hierarchically clustered by similarity
This heat map freezes the system in cross-section.
It shows how correlation concentrates into clusters rather than spreading evenly.
• Clusters reflect shared risk drivers, not sectors
• Tight blocks indicate reduced diversification
• Separation between clusters can vanish quickly under stress
• Structure reveals fragility long before prices do
These blocks are not accidental.
They are the architecture of risk.
The Structural Read
Across all four views, the conclusion is the same:
• correlation tightens before volatility reacts
• breadth thins beneath stable indices
• differentiation fades before repricing
• structure becomes fragile before stress becomes visible
Calm markets do not imply stable structure.
They often imply deferred repricing.
Methodology
• Daily equity data
• Universe: large-cap US equities
• Correlation: rolling 90-day pairwise average
• Breadth: % of stocks above 200-day MA
• Dispersion: cross-sectional return dispersion (20-day, annualised)
• Volatility: SPY realised volatility (20-day, annualised)
• Structure: hierarchical clustering on correlation distance
• Event windows: major stress regimes for alignment
• Sources: Yahoo Finance
• Analysis: Laura Brennan


