
When Fear Becomes Systemic
Diversification Weakens as Markets Synchronise
Key Takeaways
• Sector correlation rises steadily as volatility regimes deteriorate
• Crisis environments compress diversification across sectors
• Dispersion increases during stress but does not guarantee independence
• Systemic risk emerges when markets begin trading as one system
Markets rarely break because volatility spikes.
They become fragile when independence disappears.
This Insight examines how sector synchronisation evolves across volatility regimes, how dispersion behaves during stress, and how diversification erodes when markets begin reacting to the same information.
Across cycles, one structural pattern repeats:
Synchronisation rises as systemic stress increases.
Sector Synchronisation
When markets begin trading as one system
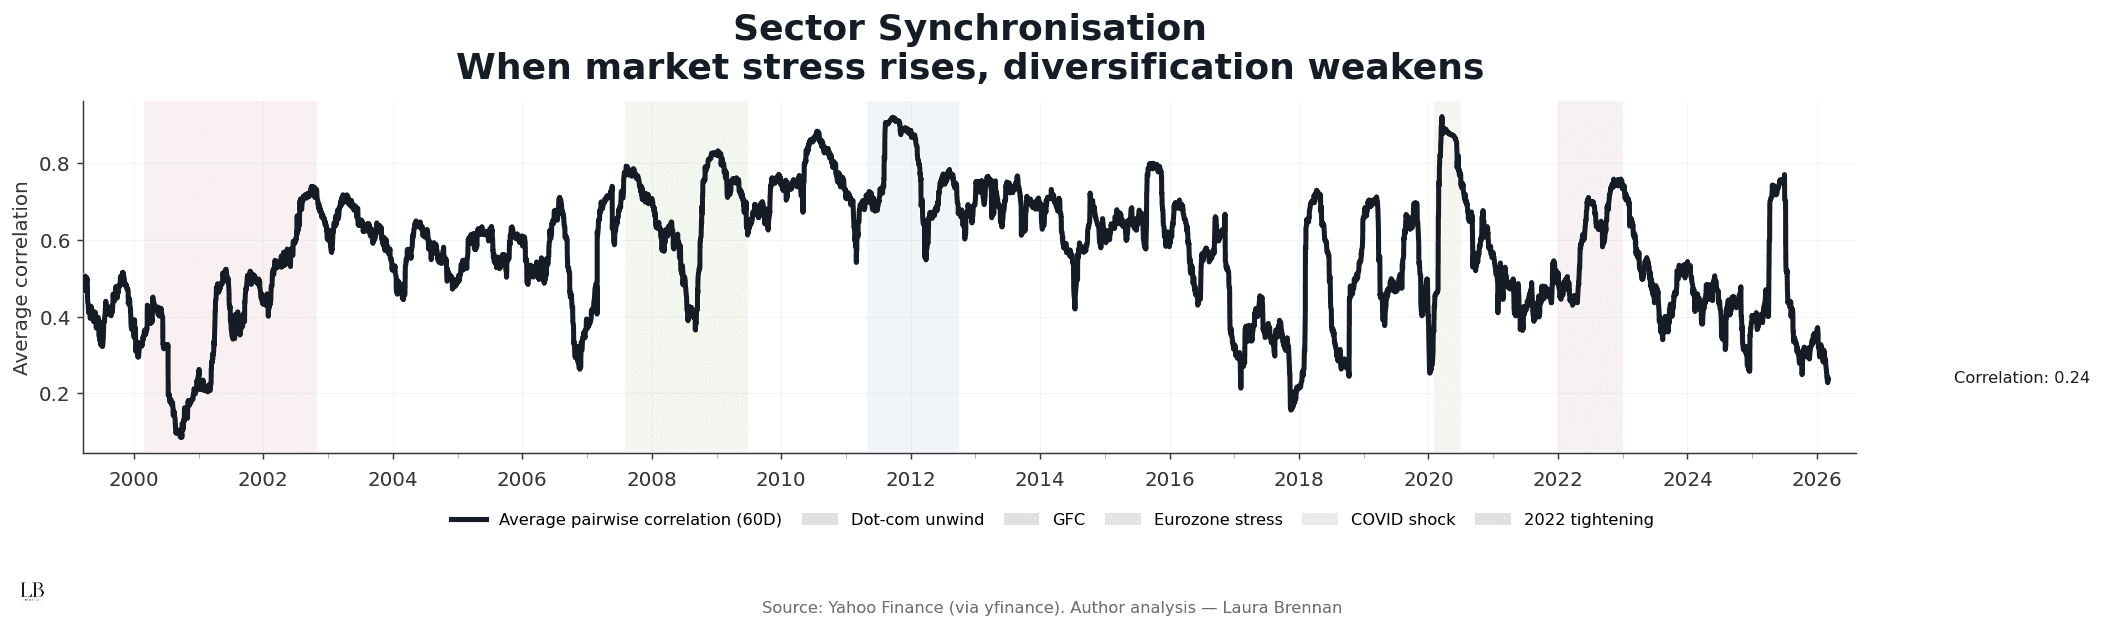
This chart measures rolling average pairwise correlation across nine US equity sectors using a 60-day window.
It captures how tightly sectors move together over time.
What emerges
• Correlation rises sharply during systemic stress
• Crisis regimes compress sector independence
• Calm regimes allow sector behaviour to diverge
• Synchronisation often increases before visible volatility spikes
When correlation rises, diversification weakens.
Assets that normally behave independently begin reacting to the same signals.
Sector Dispersion
When disagreement increases inside the market
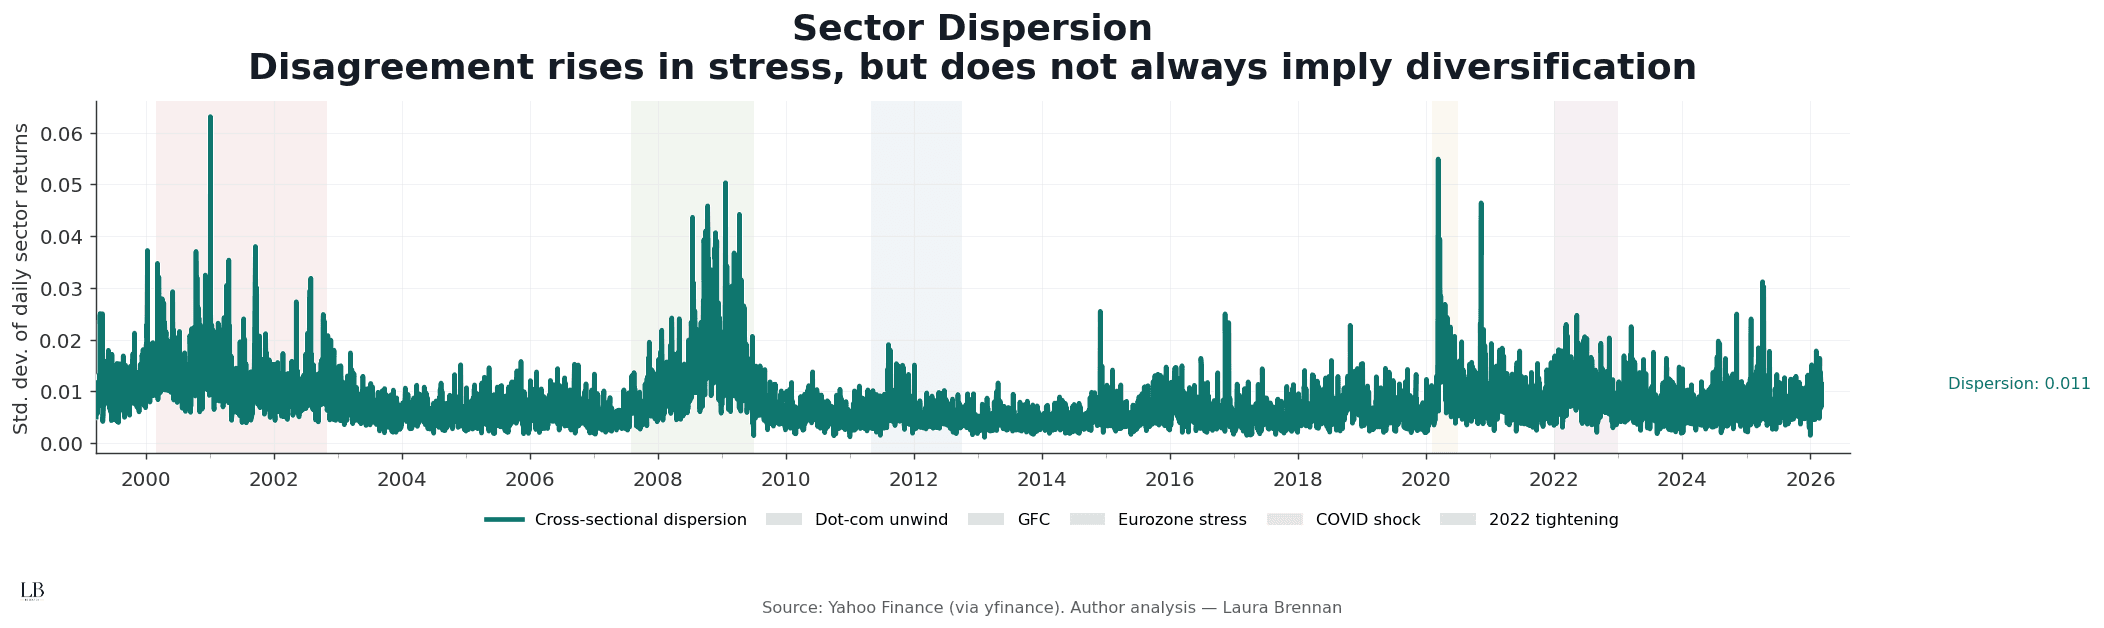
Dispersion measures the cross-sectional standard deviation of daily sector returns.
It captures how widely sector performance diverges at any point in time.
What stands out
• Dispersion rises during major stress regimes
• Sector disagreement spikes during crises
• High dispersion does not necessarily imply diversification
• Structural stress can coexist with elevated disagreement
Dispersion reflects disagreement.
But disagreement alone does not guarantee independence.
Correlation and Volatility
When fear tightens the system
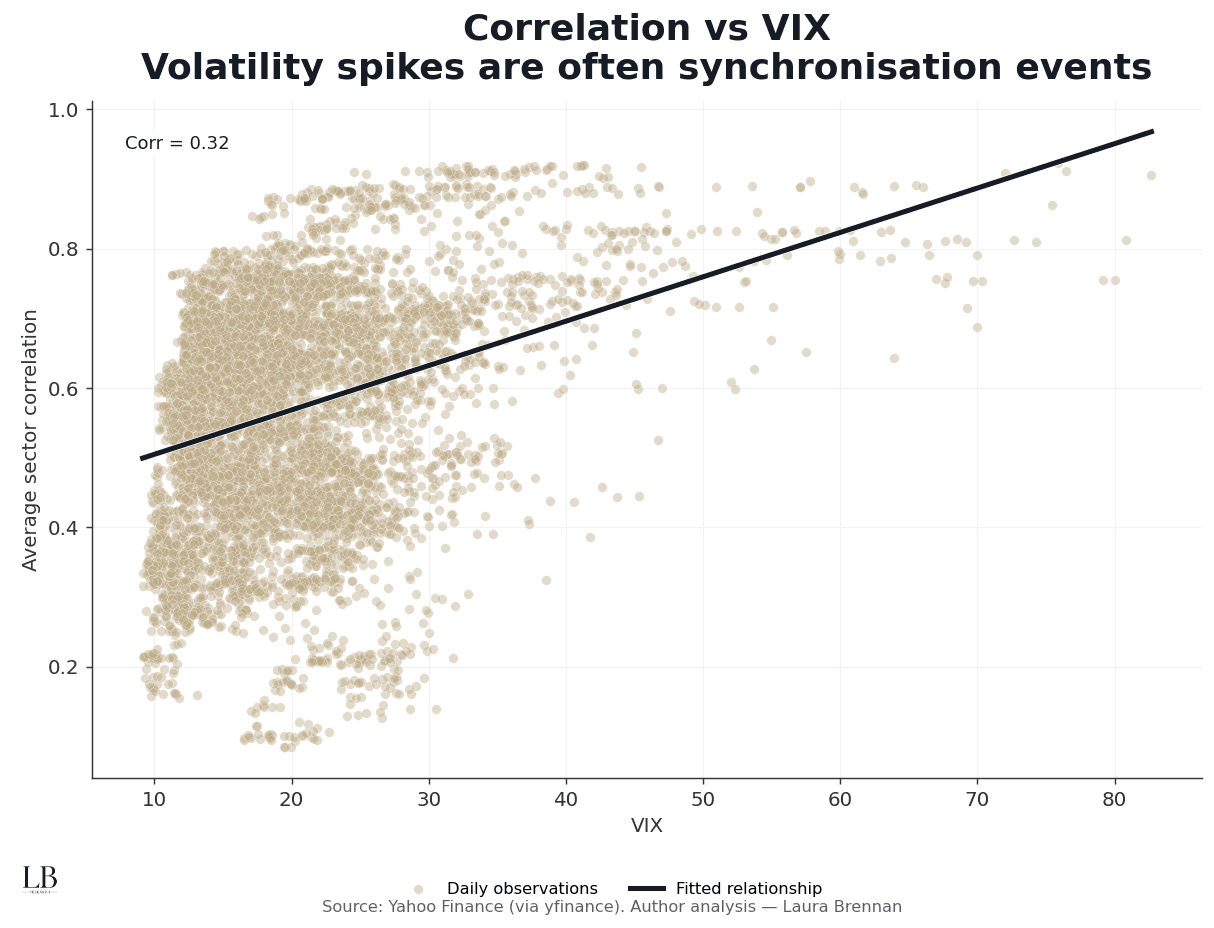
This chart compares sector correlation with the VIX, a widely used measure of market volatility.
Each observation represents the relationship between volatility and synchronisation on a given day.
What emerges
• Higher volatility regimes coincide with higher correlation
• Synchronisation increases as market fear rises
• Crisis environments show the strongest structural alignment
• Diversification weakens as volatility becomes systemic
Volatility spikes do more than increase uncertainty.
They tighten the system.
Volatility Regimes and Diversification
How correlation changes across stress levels
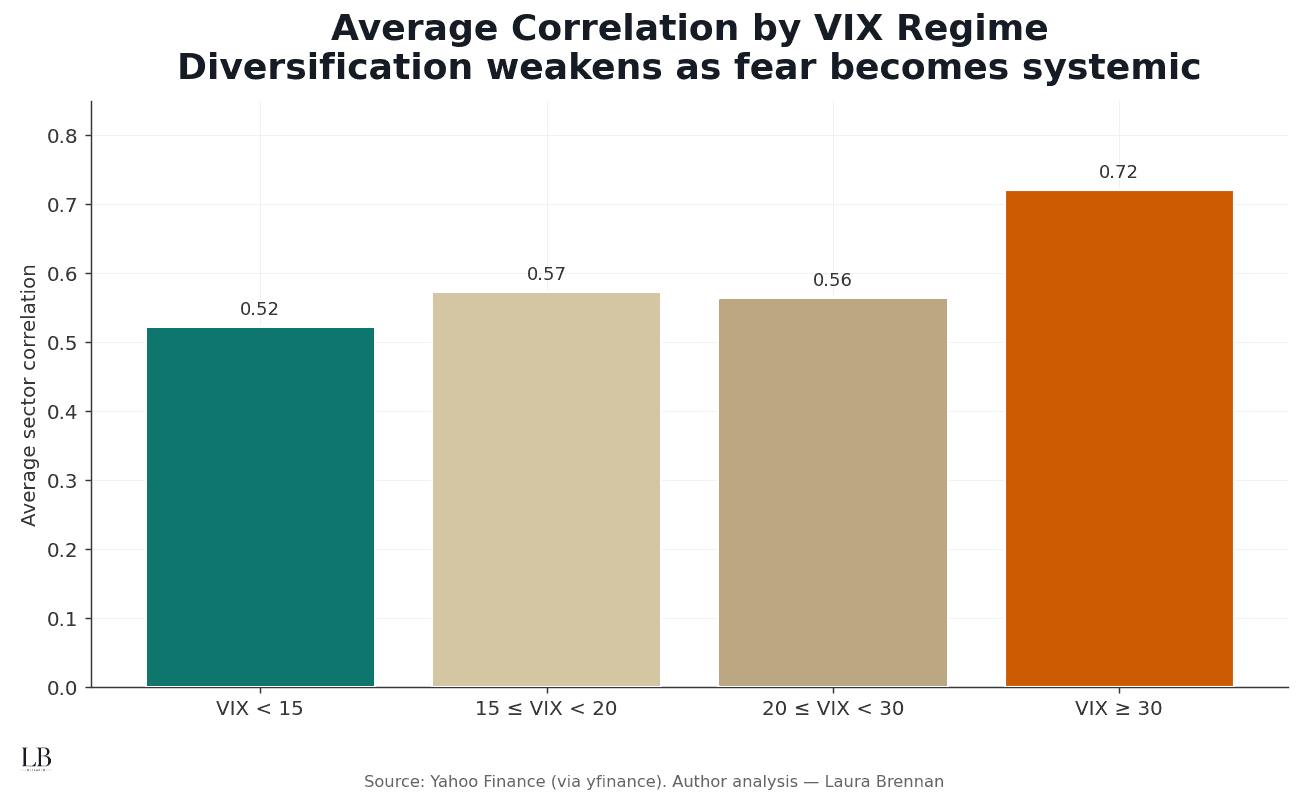
This chart groups sector correlation by volatility regime.
It shows how diversification evolves as markets move from calm conditions to crisis environments.
Key observation
Sector independence declines steadily as volatility increases.
Average correlation rises from roughly 0.52 in calm regimes to approximately 0.72 during crisis regimes.
When fear becomes systemic, diversification compresses.
Dispersion vs Synchronisation
Why disagreement and correlation are not the same
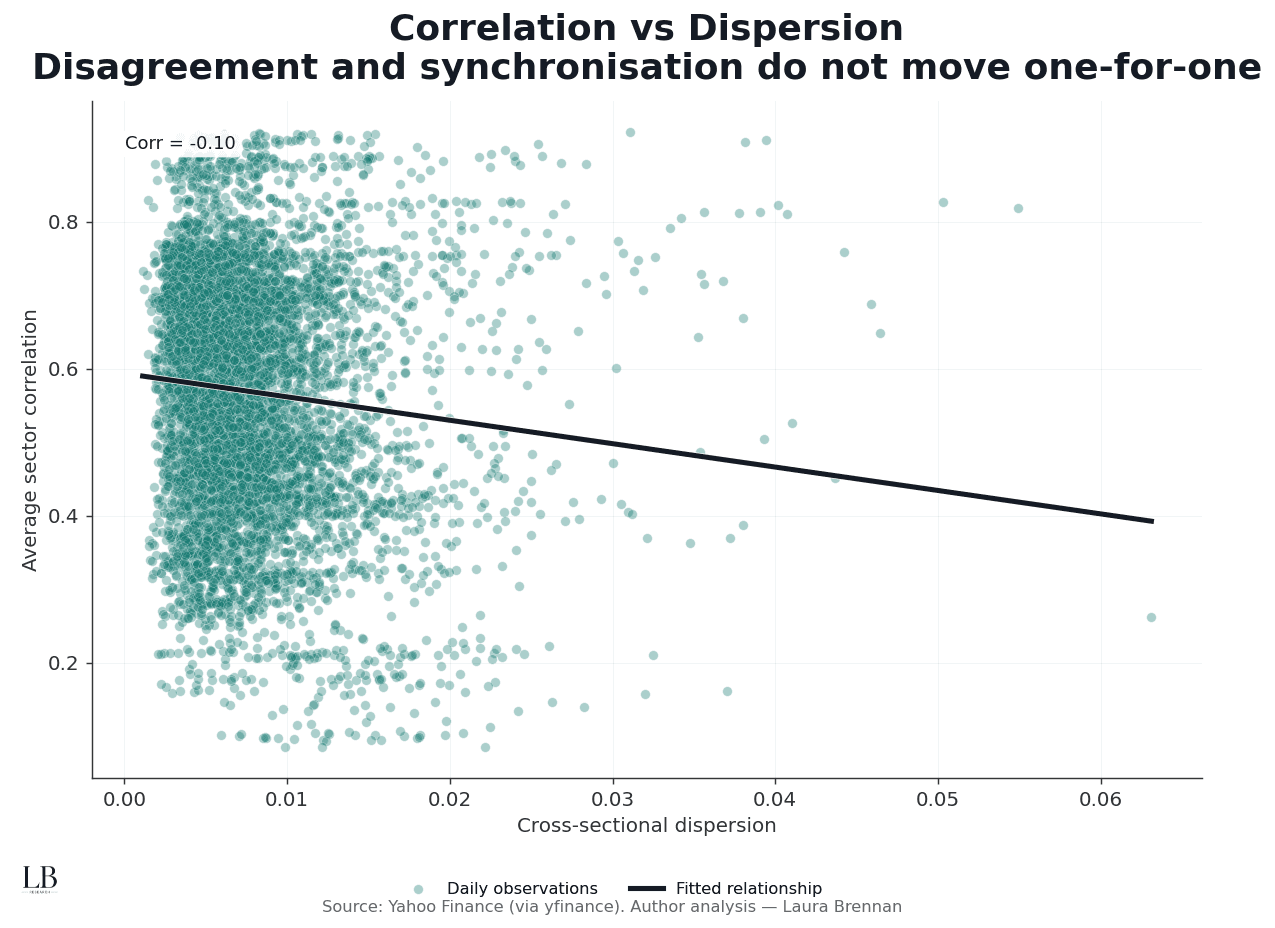
This chart compares sector dispersion with sector correlation.
It highlights an important structural distinction.
What it shows
• Dispersion and correlation are only weakly related
• Markets can display disagreement while still moving together
• Structural synchronisation can coexist with elevated dispersion
• Diversification cannot be inferred from dispersion alone
Disagreement and synchronisation capture different dimensions of market behaviour.
Both are required to understand structural fragility.
Structural Interpretation
Across these perspectives, a consistent pattern emerges.
• Synchronisation increases as volatility regimes deteriorate
• Diversification weakens as sector behaviour aligns
• Dispersion rises but does not guarantee independence
• Crisis regimes compress the market into a more unified system
Systemic risk is not simply volatility.
It is the loss of independence across assets.
When markets begin trading as one system, fragility increases.
Methodology
• Universe: US sector ETFs (XLB, XLE, XLF, XLI, XLK, XLP, XLU, XLV, XLY)
• Frequency: Daily
• Returns: Log returns
• Correlation measure: Average pairwise correlation (60-day window)
• Dispersion measure: Cross-sectional standard deviation of daily sector returns
• Volatility regimes: VIX buckets (<15, 15–20, 20–30, ≥30)
• Source: Yahoo Finance
• Analysis: Laura Brennan


