
Where Losses Actually Amplify
Why short shocks fade, but structural stress lingers
Markets do not amplify losses at the moment of the shock.
They amplify them during the adjustment.
This Insight shows where losses actually compound in equity markets by separating liquidity stress from volatility response, and tracing how stress propagates through market structure over time.
Across cycles, the pattern is consistent:
volatility spikes quickly, but losses accumulate when liquidity fails to recover.
Liquidity Thins First
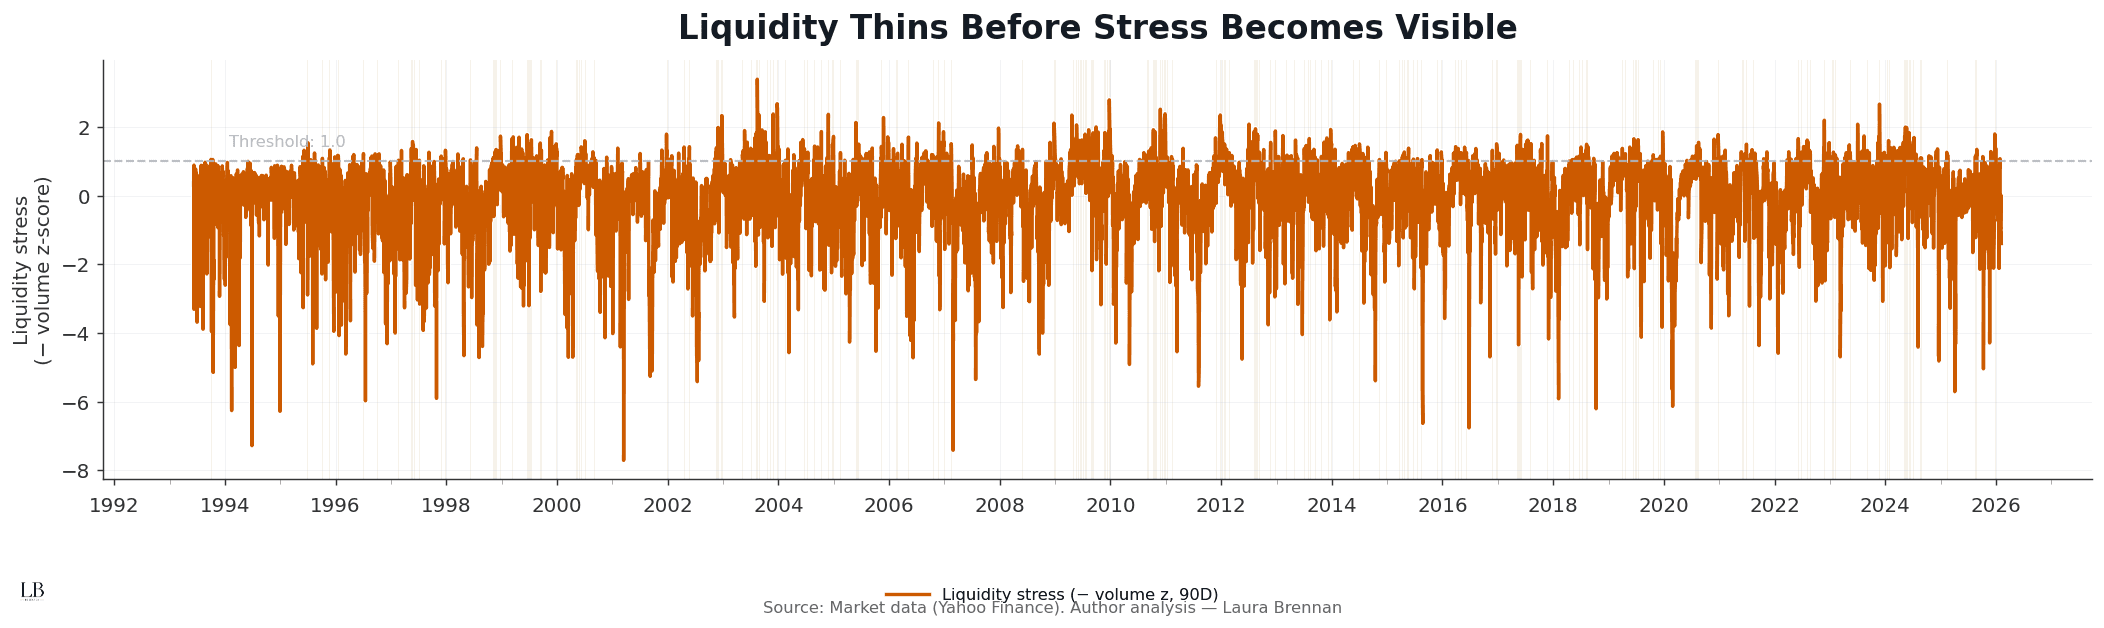
This chart tracks liquidity stress, measured as an inverted volume z-score, with shaded regimes marking sustained deterioration in market depth.
What it shows:
• Liquidity weakens before price stress becomes visible
• Stress regimes emerge quietly, often without volatility
• Liquidity deterioration does not require a shock to begin
• Many regimes overlap and persist across cycles
Losses do not start with volatility.
They start when market depth erodes.
Volatility Responds During Adjustment
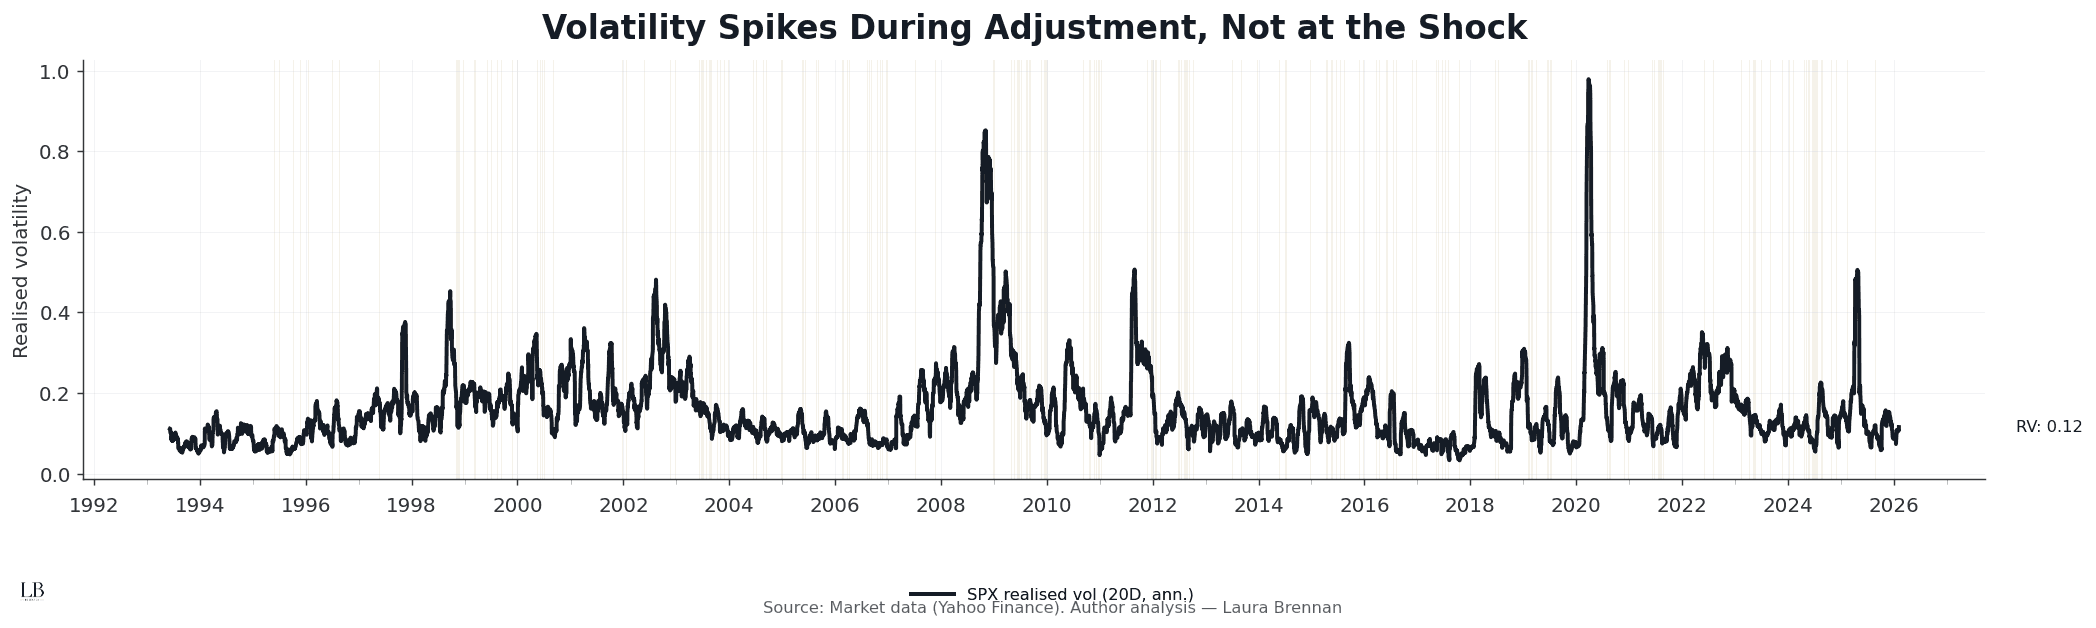
This chart shows realised volatility, aligned with the same liquidity stress regimes.
What stands out:
• Volatility spikes occur inside liquidity stress regimes
• Many liquidity breaks pass without immediate price disruption
• The largest volatility moves occur during adjustment, not onset
• Price instability follows structural weakening
Volatility measures reaction.
It does not measure damage.
Liquidity Leads Volatility
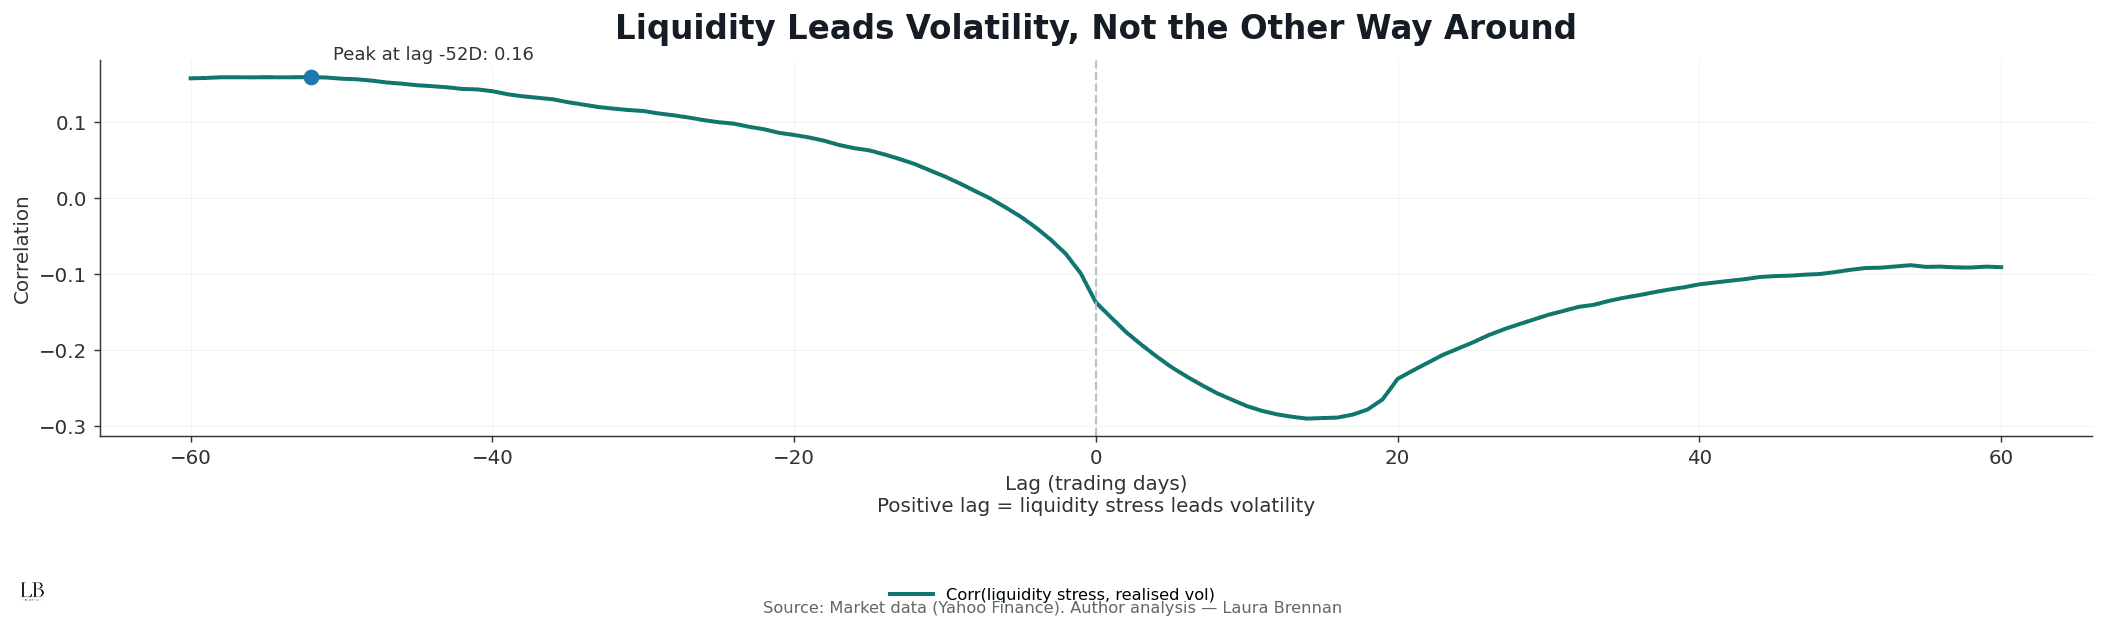
This chart maps the cross-correlation between liquidity stress and realised volatility across trading-day lags.
How to read it:
• Positive lag = liquidity stress leads volatility
• Negative lag = volatility leads liquidity
What emerges:
• Correlation peaks when liquidity stress leads volatility
• The signal weakens when volatility is treated as the driver
• Liquidity deterioration is an early mechanism, not a response
Losses amplify where liquidity moves first.
Once Liquidity Breaks, Volatility Persists
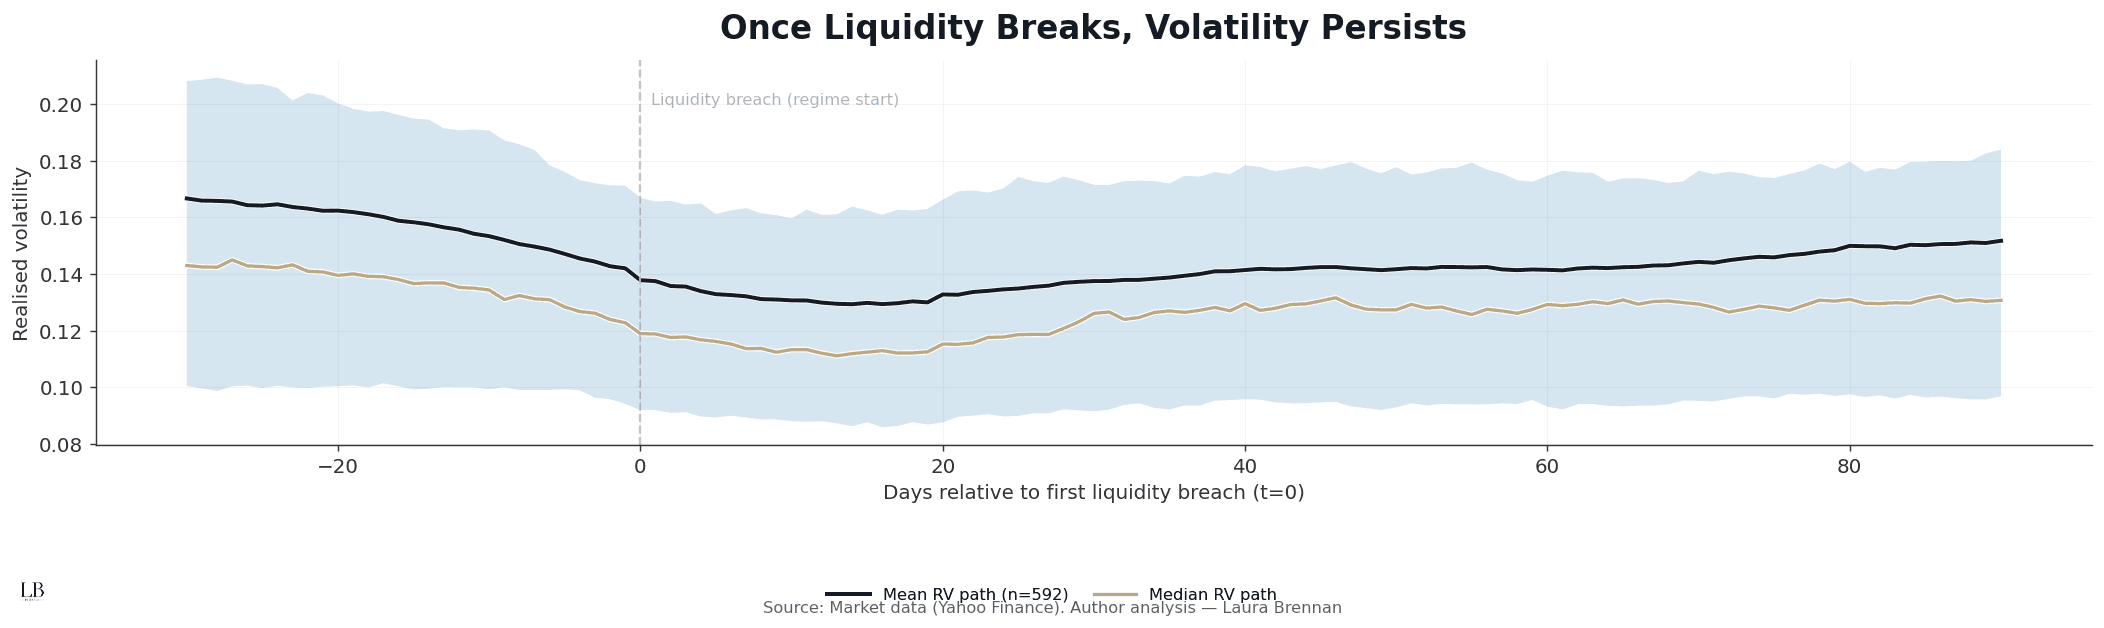
This chart aligns volatility paths around the first transition into a liquidity stress regime, averaged across all episodes.
What it reveals:
• Volatility does not peak at the breach
• Stress accumulates gradually after liquidity deteriorates
• Once elevated, volatility remains persistent
• Recovery is slow and asymmetric
Shocks fade.
Structural stress compounds.
The Structural Read
Across all four views, the conclusion is the same:
• losses do not amplify at the shock
• they amplify during adjustment
• liquidity failure is the transmission channel
• persistence matters more than peaks
Markets do not fail because volatility spikes.
They fail because liquidity does not heal.
Methodology
• Assets: SPX (prices), SPY (volume proxy)
• Prices: daily close
• Returns: log returns
• Realised volatility: 20-day rolling, annualised
• Liquidity stress: inverted SPY volume z-score (90-day window)
• Regime threshold: liquidity stress > 1.0
• Event definition: first transition into liquidity stress regime
• Lead–lag: cross-correlation across ±60 trading days
• Source: Yahoo Finance
• Analysis: Laura Brennan


